
BACKGROUND
Sickle cell disease (SCD) is a rare, debilitating chronic disease caused by abnormalities in hemoglobin (Hb) that affects approximately 100 000 individuals in the United States.1 These abnormalities cause red blood cells to take on a “sickle” shape. Sickle cells die faster than normal red blood cells, leading to a constant shortage of red blood cells in patients with SCD.2 Furthermore, sickle cells may become lodged within small blood vessels, impairing blood flow and often leading to organ damage and complications such as infections, pain, and stroke.1–3
Pain and fatigue are common symptoms in patients with SCD, with more than 50% experiencing pain and more than 80% experiencing fatigue daily.4,5 Intensive management is often required to treat SCD and related complications, resulting in a high economic burden associated with SCD.6,7 However, the economic burden associated with acute pain and fatigue in patients with SCD remains unclear. Given the high prevalence of these symptoms, a better understanding of healthcare resource utilization (HCRU) and medical costs may provide insights to payers on the potential cost offset and value of SCD disease-modifying therapies.
This study aimed to evaluate the association of acute pain and fatigue with HCRU and medical costs among patients with SCD in real-world settings using integrated claims and electronic health record (EHR) data. The primary objective was to compare all-cause HCRU and costs across the following cohorts: patients with SCD with both acute pain and fatigue (cases) and those without (controls); patients with acute pain (cases) and those without (controls); and patients with fatigue (cases) and those without (controls). Secondary objectives included evaluation of HCRU and costs specific to acute pain and fatigue, as well as those unrelated to these symptoms, across all cohorts.
METHODS
Study Design
This retrospective longitudinal cohort study used data from the TriNetX Linked Network claims database and TriNetX Dataworks-USA EHR data to evaluate HCRU and direct costs among patients with SCD diagnosed from October 1, 2015 (the date of International Classification of Diseases, Tenth Revision, Clinical Modification [ICD-10-CM] implementation in the United States), through June 21, 2024 (the most recent available date in the dataset at the time of the analysis; Supplemental Figure S1). The chosen start date for the study period also allowed the availability and use of newer SCD treatments including L-glutamine oral powder and crizanlizumab-tmca to be captured.8,9
Acute pain was defined as an emergency department (ED) or inpatient encounter with an ICD-10-CM code for generic pain or SCD crisis, accompanied by either administration of intravenous pain medication during the encounter or an opioid prescription within 7 days after the encounter. This definition was based on a modified version of the algorithm developed by Singh et al, which is validated for use in patients with SCD.10 Pain medications included in this study were based on expert input and included buprenorphine, benzhydrocodone, butorphanol, codeine, dihydrocodeine, fentanyl (transdermal in outpatient setting or injection in ED setting), hydrocodone, hydromorphone, levorphanol, meperidine, methadone, morphine, morphine liposomal, nalbuphine, oliceridine, oxycodone, oxymorphone, pentazocine, propoxyphene (dextropropoxyphene), remifentanil, tapentadol, tramadol, and ketorolac. Pain controls did not meet the Singh definition for acute pain; however, control patients prescribed pain medications other than those previously specified were included in the evaluation.
Fatigue was defined using the following criteria: (1) Hb levels ≤10.0 g/dL used as a proxy for fatigue based on the National Cancer Institute anemia grades or (2) fatigue diagnosis using ICD-10-CM codes R53.81, R53.82, or R53.83.11 ICD-10-CM codes for fatigue are underutilized in patients with SCD, and there is currently no validated algorithm for identifying fatigue in patients with SCD. Additionally, National Cancer Institute anemia grades may not be a strong proxy for fatigue. Thus, sensitivity analyses were conducted using a subset of patients for whom fatigue was defined solely by ICD-10-CM codes. The index date for patients with SCD with acute pain or fatigue was defined as the first observed encounter with acute pain or fatigue occurring after a ≥12-month baseline period (ie, without acute pain or fatigue) with continuous health insurance coverage (preindex period). For patients with both acute pain and fatigue, the index date was defined as the first date on which the second condition (ie, either acute pain or fatigue) had been observed within 12 months of the first condition to ensure both acute pain and fatigue co-occurred. Patients with SCD in the respective control groups (ie, without acute pain, without fatigue, or without both) were assigned randomly generated pseudo-index dates after ≥12 months of continuous health insurance coverage and prior to 12 months before the end of the follow-up period. Annual HCRU and costs were assessed following a 12-month postindex period.
Data Sources
TriNetX comprises federated EHRs and datasets from networks of healthcare organizations, including records of healthcare encounters, patient demographics, mortality, and provider information. The TriNetX Dataworks-USA EHR data were used to identify additional patients with fatigue. This data source was chosen for its ability to provide a large EHR sample and information on key variables, including laboratory values. The TriNetX Linked Network was used for the evaluation of HCRU and costs, which included imputed paid amounts, representing expected costs to payers. This data source was chosen for its ability to provide a linked EHR and closed claims sample and information on healthcare costs.
Study Population
The study population included patients aged ≥12 years with SCD at the index date. Patients were included if they had ≥1 inpatient or ≥2 outpatient SCD diagnoses (separated by ≥1 month but <1 year) with the following ICD-10-CM codes in any position: D57.0x, D57.1x, D57.2x, D57.4x, or D57.8x. Additional inclusion criteria were ≥12 months of pre-index and ≥12 months of postindex continuous insurance eligibility.
Patients were excluded from the study if they had a ICD-10-CM diagnosis code for sickle cell trait (D57.3) at any point during the study period in either the EHR or closed claims data or if they had evidence of gene therapy or stem cell transplantation prior to their index date. For all cohorts, patients were required to have a 12-month baseline period without the symptoms defining that cohort (ie, without acute pain, without fatigue, or without both). Patients were included in the acute pain and fatigue cohort if both conditions were identified, as previously defined, within 12 months of each other. Controls for this cohort were patients with no evidence of either acute pain or fatigue. Patients were included in the acute pain or fatigue cohorts if they met the respective definitions of acute pain or fatigue. Controls for these cohorts were patients with no evidence of acute pain (acute pain cohort) or fatigue (fatigue cohort). Of note, patients could be included in more than one cohort if they met the respective symptom definitions. However, in the comparisons used, the groups were mutually exclusive. Thus, the overlap does not impact the associated incremental effect of both acute pain and fatigue, acute pain, and fatigue.
Statistical Analyses
The total number of cases and controls meeting the respective inclusion criteria was calculated and summarized for each cohort. Descriptive analyses were used to summarize baseline clinical and demographic characteristics. Annual utilization of inpatient hospitalizations, outpatient visits, ED visits, and prescriptions was dichotomized and summarized as the number (%) of patients. Annual healthcare costs, overall and by setting or type of care, were summarized using mean, standard deviation, minimum, median, maximum, and 25th and 75th percentiles. Nonparametric Wilcoxon tests (for continuous measures) or Fisher exact or chi-square tests (for categorical measures) were used to assess differences between cases and controls.
Regression-adjusted estimates of the HCRU and total healthcare costs associated with acute pain and fatigue, acute pain alone, and fatigue alone were generated. Logistic regression models were used to estimate the odds of utilization of each specific type of care associated with the main effects (acute pain and fatigue, acute pain, and fatigue). Based on the relatively large sample size, linear regression models were used to estimate the incremental effect of each main effect on total costs. However, in sensitivity analyses of total costs, generalized linear models with a log link and gamma distribution were used to estimate incremental total costs. Models were adjusted for sex, age at index, race, ethnicity, type of insurance at index, baseline Charlson Comorbidity Index (CCI) score, other SCD-related comorbidities, select treatments, and baseline anxiety or depression. SCD-related comorbidities included acute cholecystitis/cholangitis, acute myocardial infarction, asthma, chronic obstructive pulmonary disease (COPD), diabetes mellitus, gout, heart failure, hyperlipidemia, hypertension, obesity, osteoporosis, pneumonia, sepsis, spinal cord injury, urinary tract infection, and venous thromboembolism. To avoid loss of sample size, missing race vales were combined with the “Other” category. Costs were inflation-adjusted to 2023 US dollars (the most recent year of patients’ index dates at the time of the analysis) using the Consumer Price Index of the US Bureau of Labor Statistics. The level of significance for all tests was set at α = 0.05 (2-sided). All analyses were performed using SAS software (version 9.4 or higher) or R (version 4.4.1).
RESULTS
Baseline Demographic and Clinical Characteristics
A total of 8147 patients with SCD were included for case and control identification across the 3 cohorts. For the evaluation of acute pain and fatigue, 1075 patients with acute pain and fatigue and 451 patients without acute pain and fatigue were included (Supplemental Figure S2). For the evaluation of acute pain, 1082 patients with acute pain and 884 patients without acute pain were included (Supplemental Figure S3). For the evaluation of fatigue, 960 patients with fatigue and 1260 patients without fatigue were included (Supplemental Figure S4). The sensitivity analyses using only fatigue diagnosis codes included 623 patients with fatigue and 1260 patients without fatigue. Across all cohorts, the majority of patients were female (50.8%-58.0%) and Black or African American (75.1%-86.2%). Approximately two-thirds were enrolled in Medicaid (Table 1). Across cohorts, patients with acute pain and fatigue, acute pain, or fatigue were more likely than controls to be insured with Medicaid (74.6% vs 62.3%, respectively, for acute pain and fatigue; 72.7% vs 61.9% for acute pain; and 72.3% vs 68.7% for fatigue; all P < .001) and more likely to be Black or African American (86.2% vs 75.6%, respectively, for acute pain and fatigue; 83.0% vs 75.1% for acute pain; 82.0% vs 81.0% for fatigue; all P < .05). Patients with acute pain were younger than those without acute pain (32.4 vs 36.4 years, respectively; P < .001), whereas patients with fatigue were older than those without (35.4 vs 31.9 years, respectively; P < .001).
Across all cohorts, the most common Charlson comorbidities were chronic pulmonary disease, diabetes, and cerebrovascular disease. Congestive heart failure was also common in the fatigue cohort. In the acute pain and fatigue cohort, chronic pulmonary disease, congestive heart failure, mild liver disease, myocardial infarction, peripheral vascular disease, and renal disease were more prevalent in those with acute pain and fatigue compared with those without (all P < .001). In the acute pain cohort, the prevalence of Charlson comorbidities was similar between those with and without acute pain except for chronic pulmonary disease, which was more prevalent among those with acute pain (26.5% vs 18.8%; P < .001). In the fatigue cohort, the prevalence of most Charlson comorbidities was higher for patients with fatigue than those without (all P < .05), with the exceptions of AIDS/HIV, metastatic carcinoma, and peptic ulcer disease, which were not significantly different between the groups. Additionally, the average CCI was greater for patients with acute pain and fatigue, acute pain, or fatigue compared with those without (all P < .05). In general, SCD-related comorbidities were more prevalent among patients with acute pain and fatigue, acute pain, or fatigue than in the control cohorts. Across all cohorts, most patients did not have evidence of SCD-specific treatments during the baseline period. Pain medications were more frequently prescribed to those with acute pain and fatigue, acute pain, or fatigue than in the control cohorts.
Unadjusted HCRU and Costs
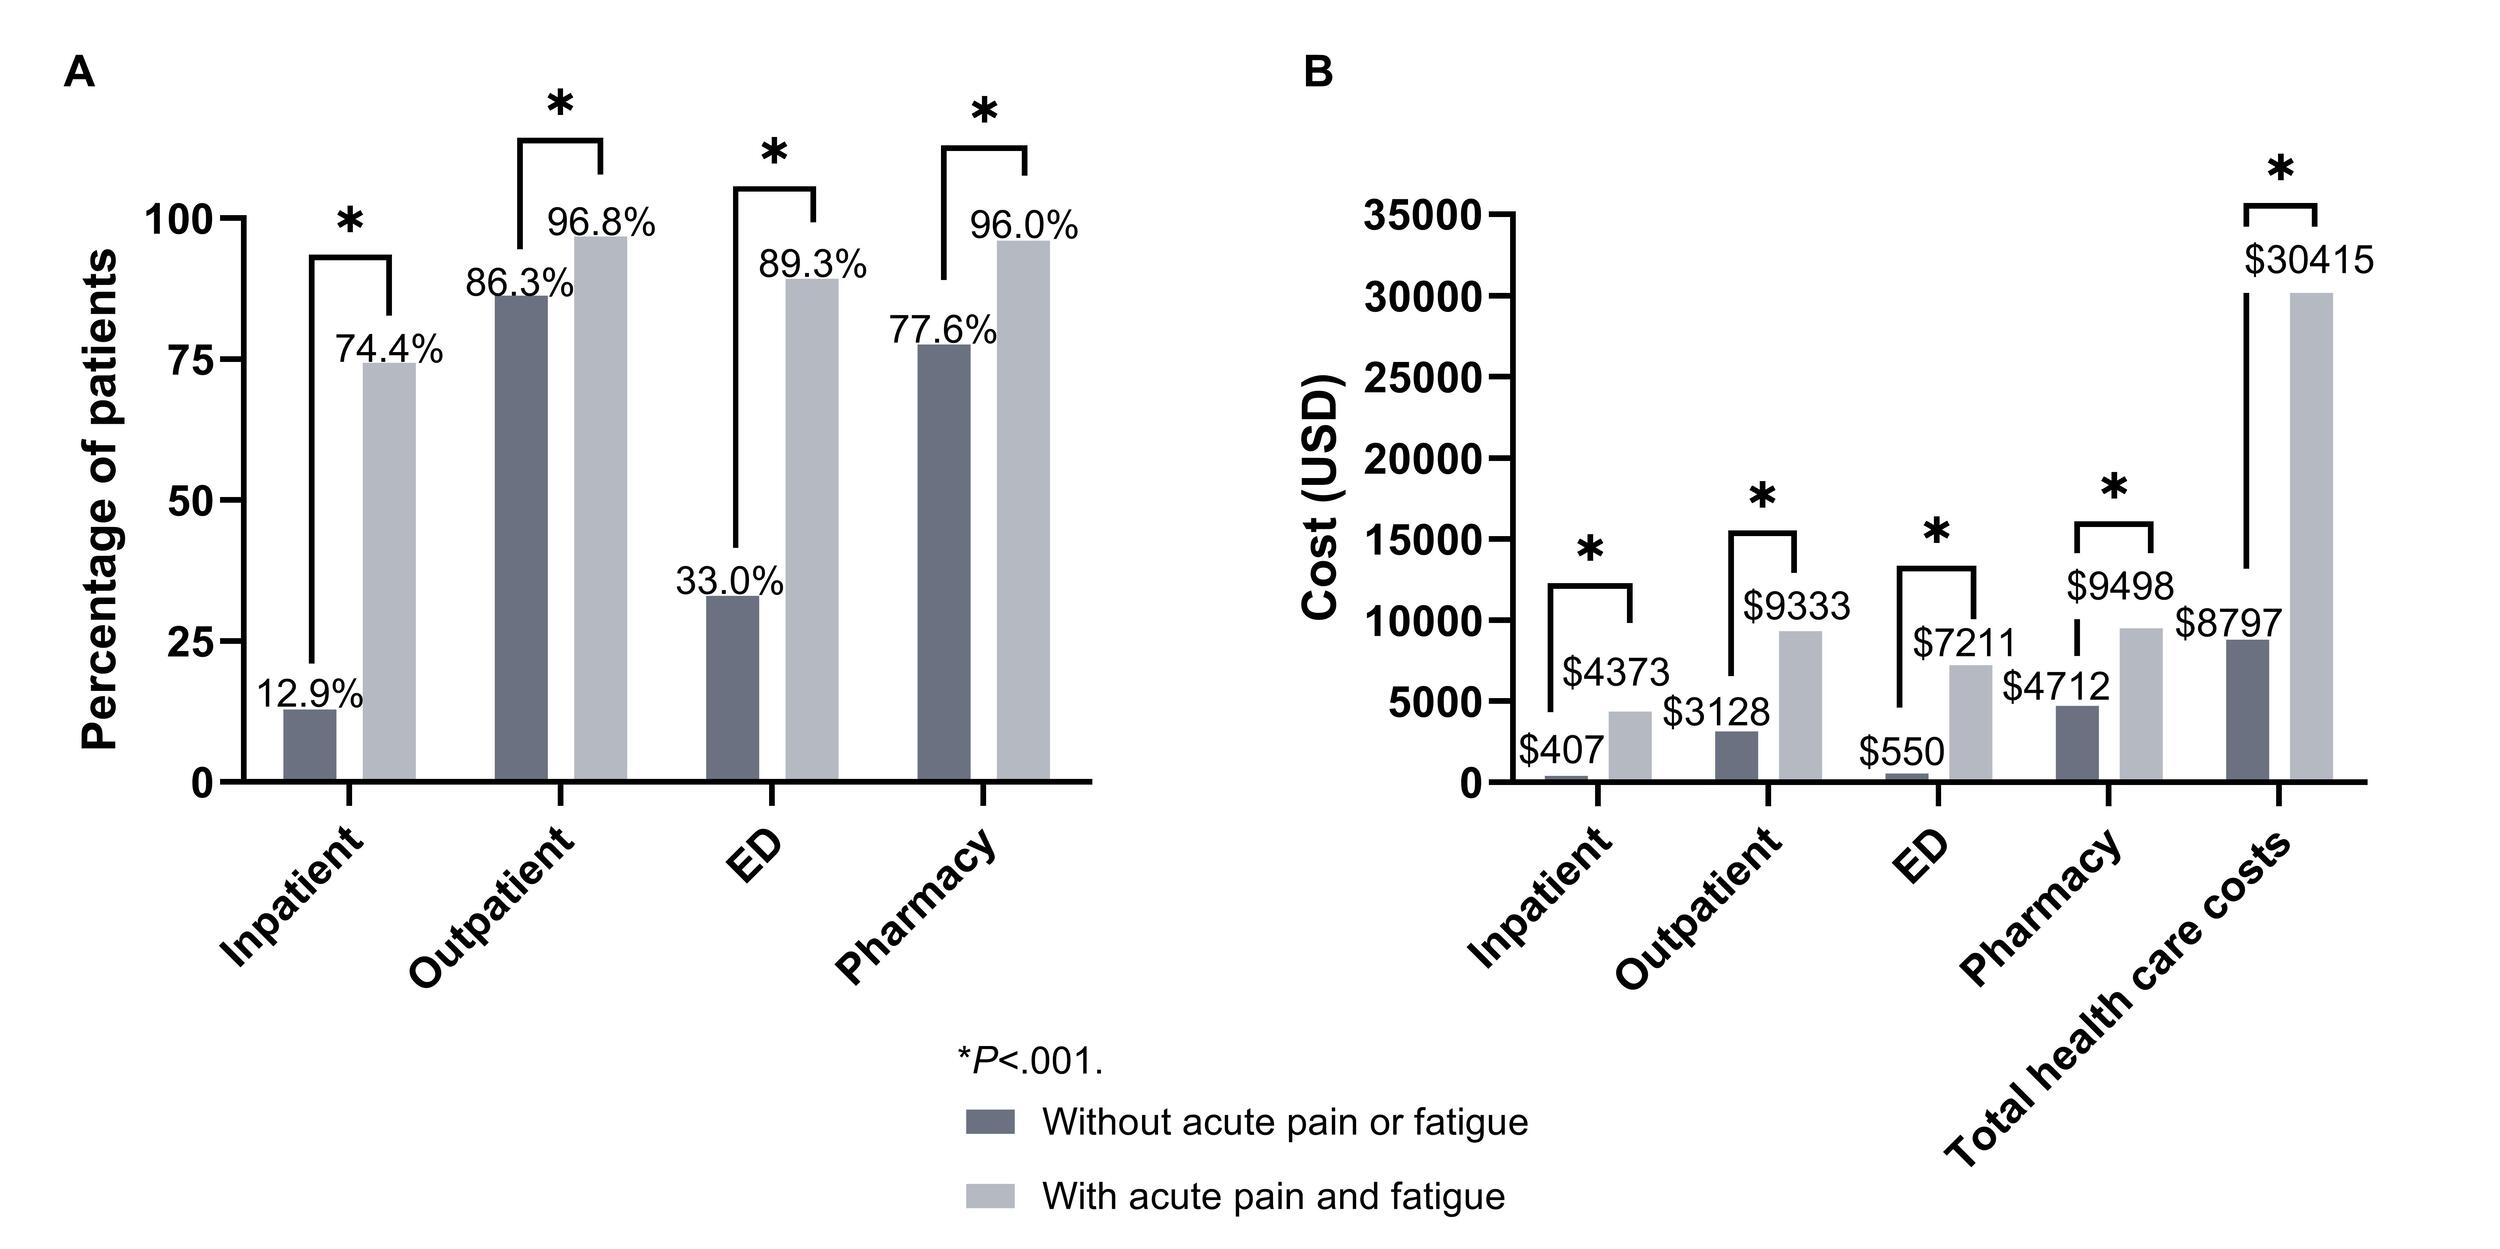
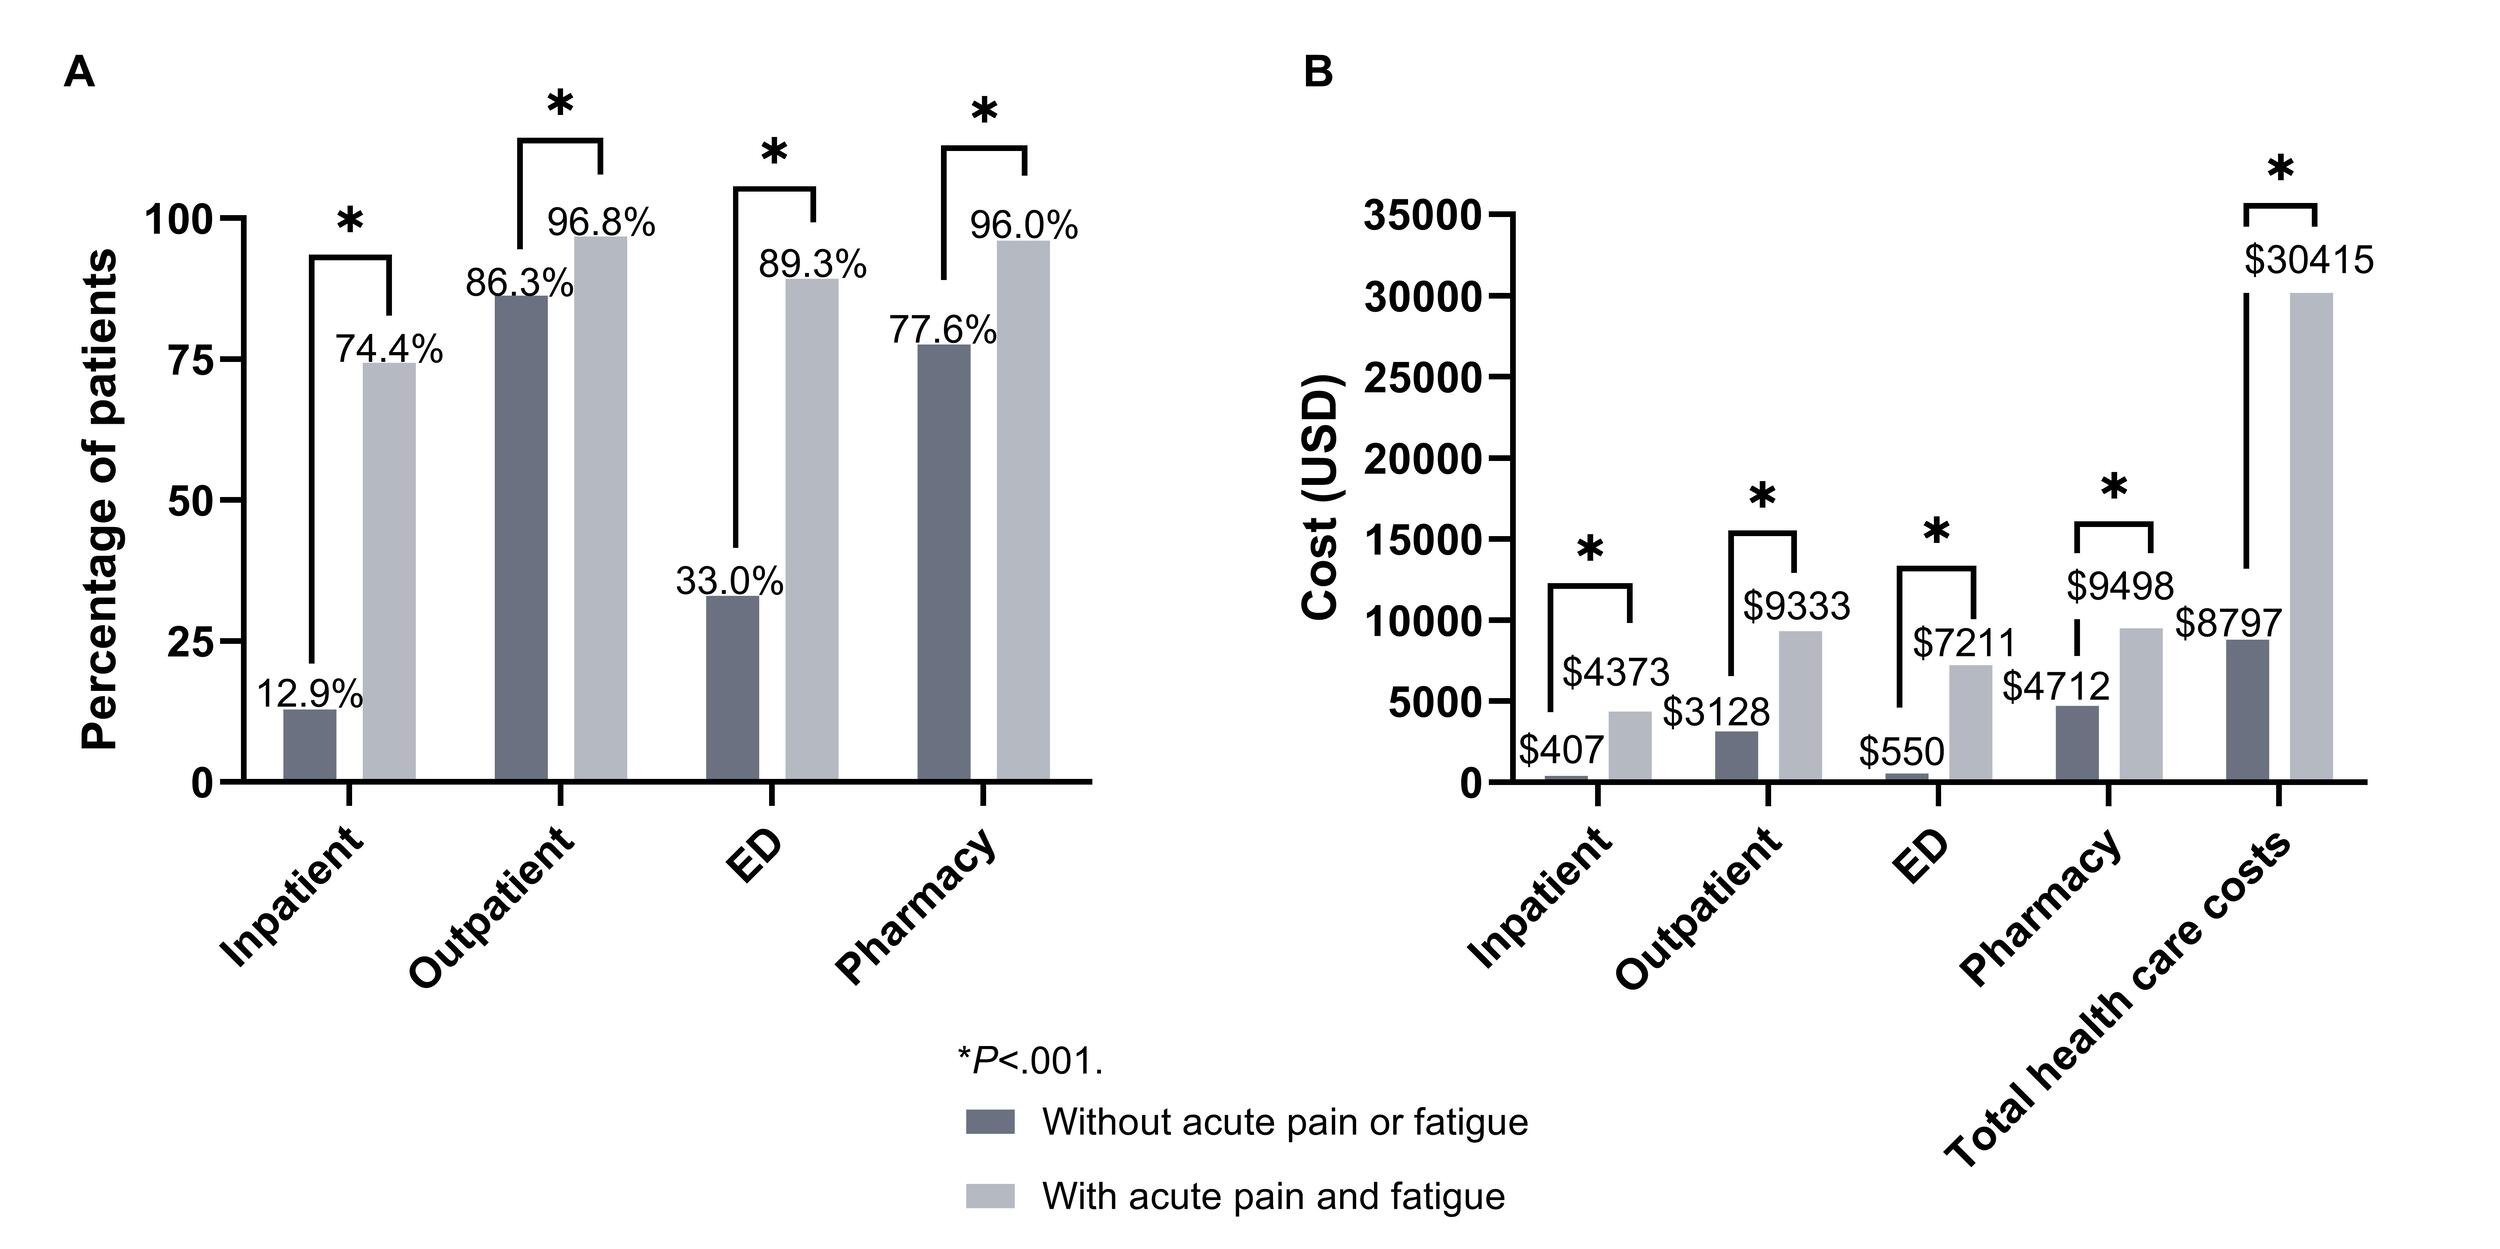
Twelve-month unadjusted all-cause HCRU was significantly higher during the postindex period in patients with both acute pain and fatigue than in those without acute pain and fatigue across all care settings (Figure 1A). These differences were most pronounced in the inpatient (74.4% vs 12.9%; P < .001) and ED (89.3% vs 33.0%; P < .001) settings. Unadjusted all-cause costs were also significantly higher in patients with both acute pain and fatigue, with an almost 250% increase in total healthcare costs compared with those without acute pain or fatigue ($30 415 vs $8797, respectively; P < .001; Figure 1B).
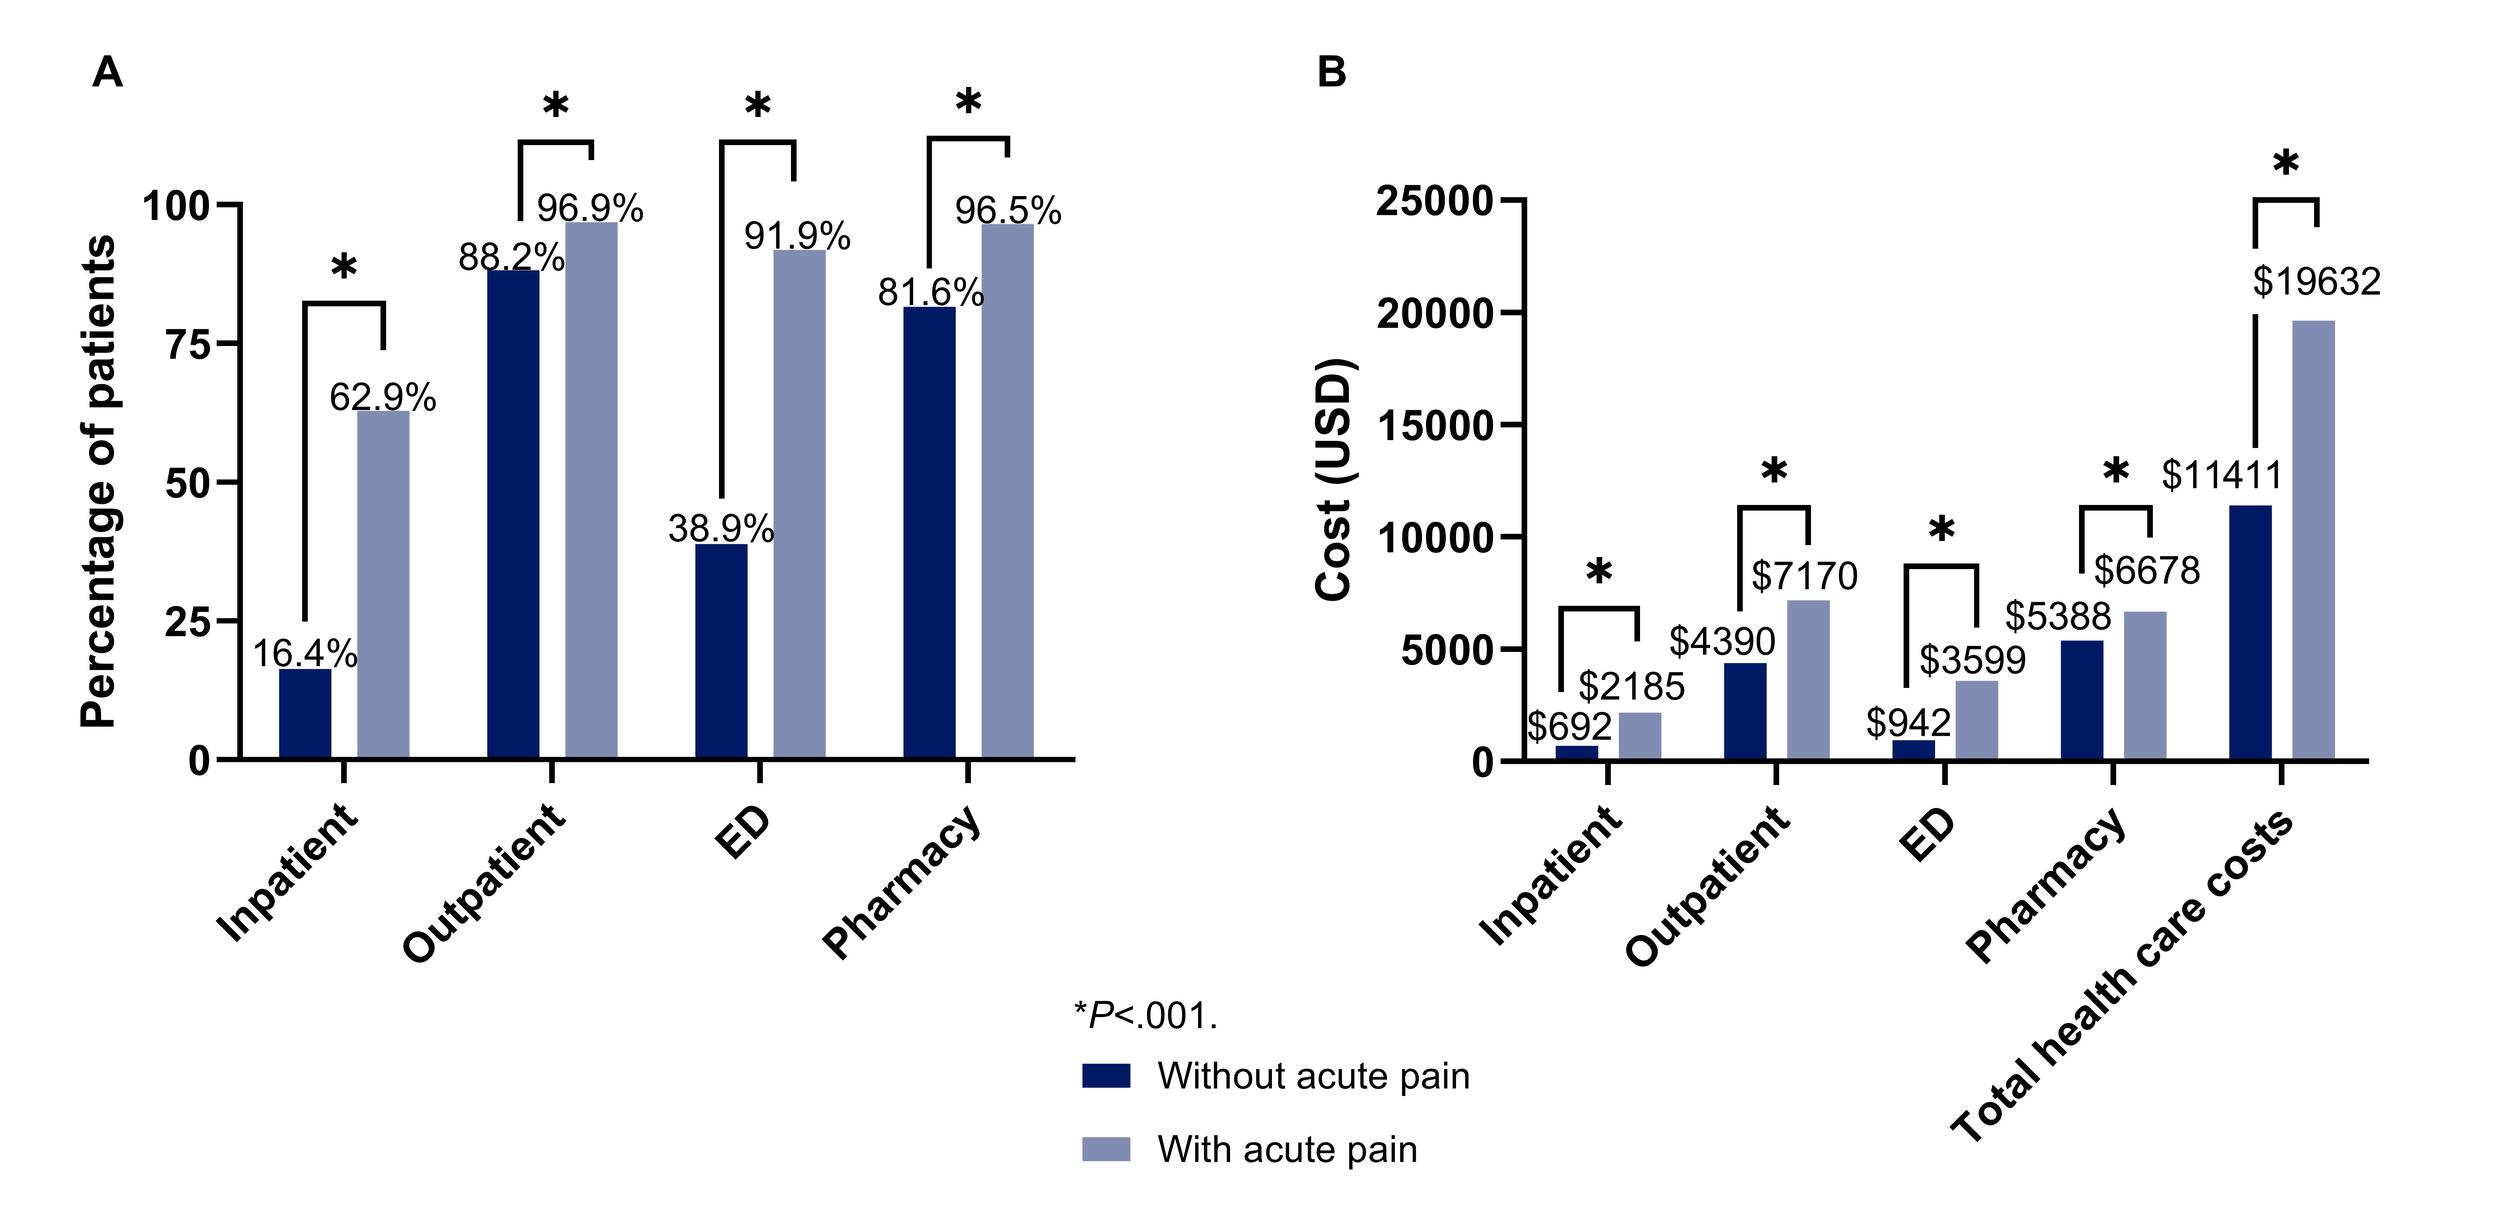
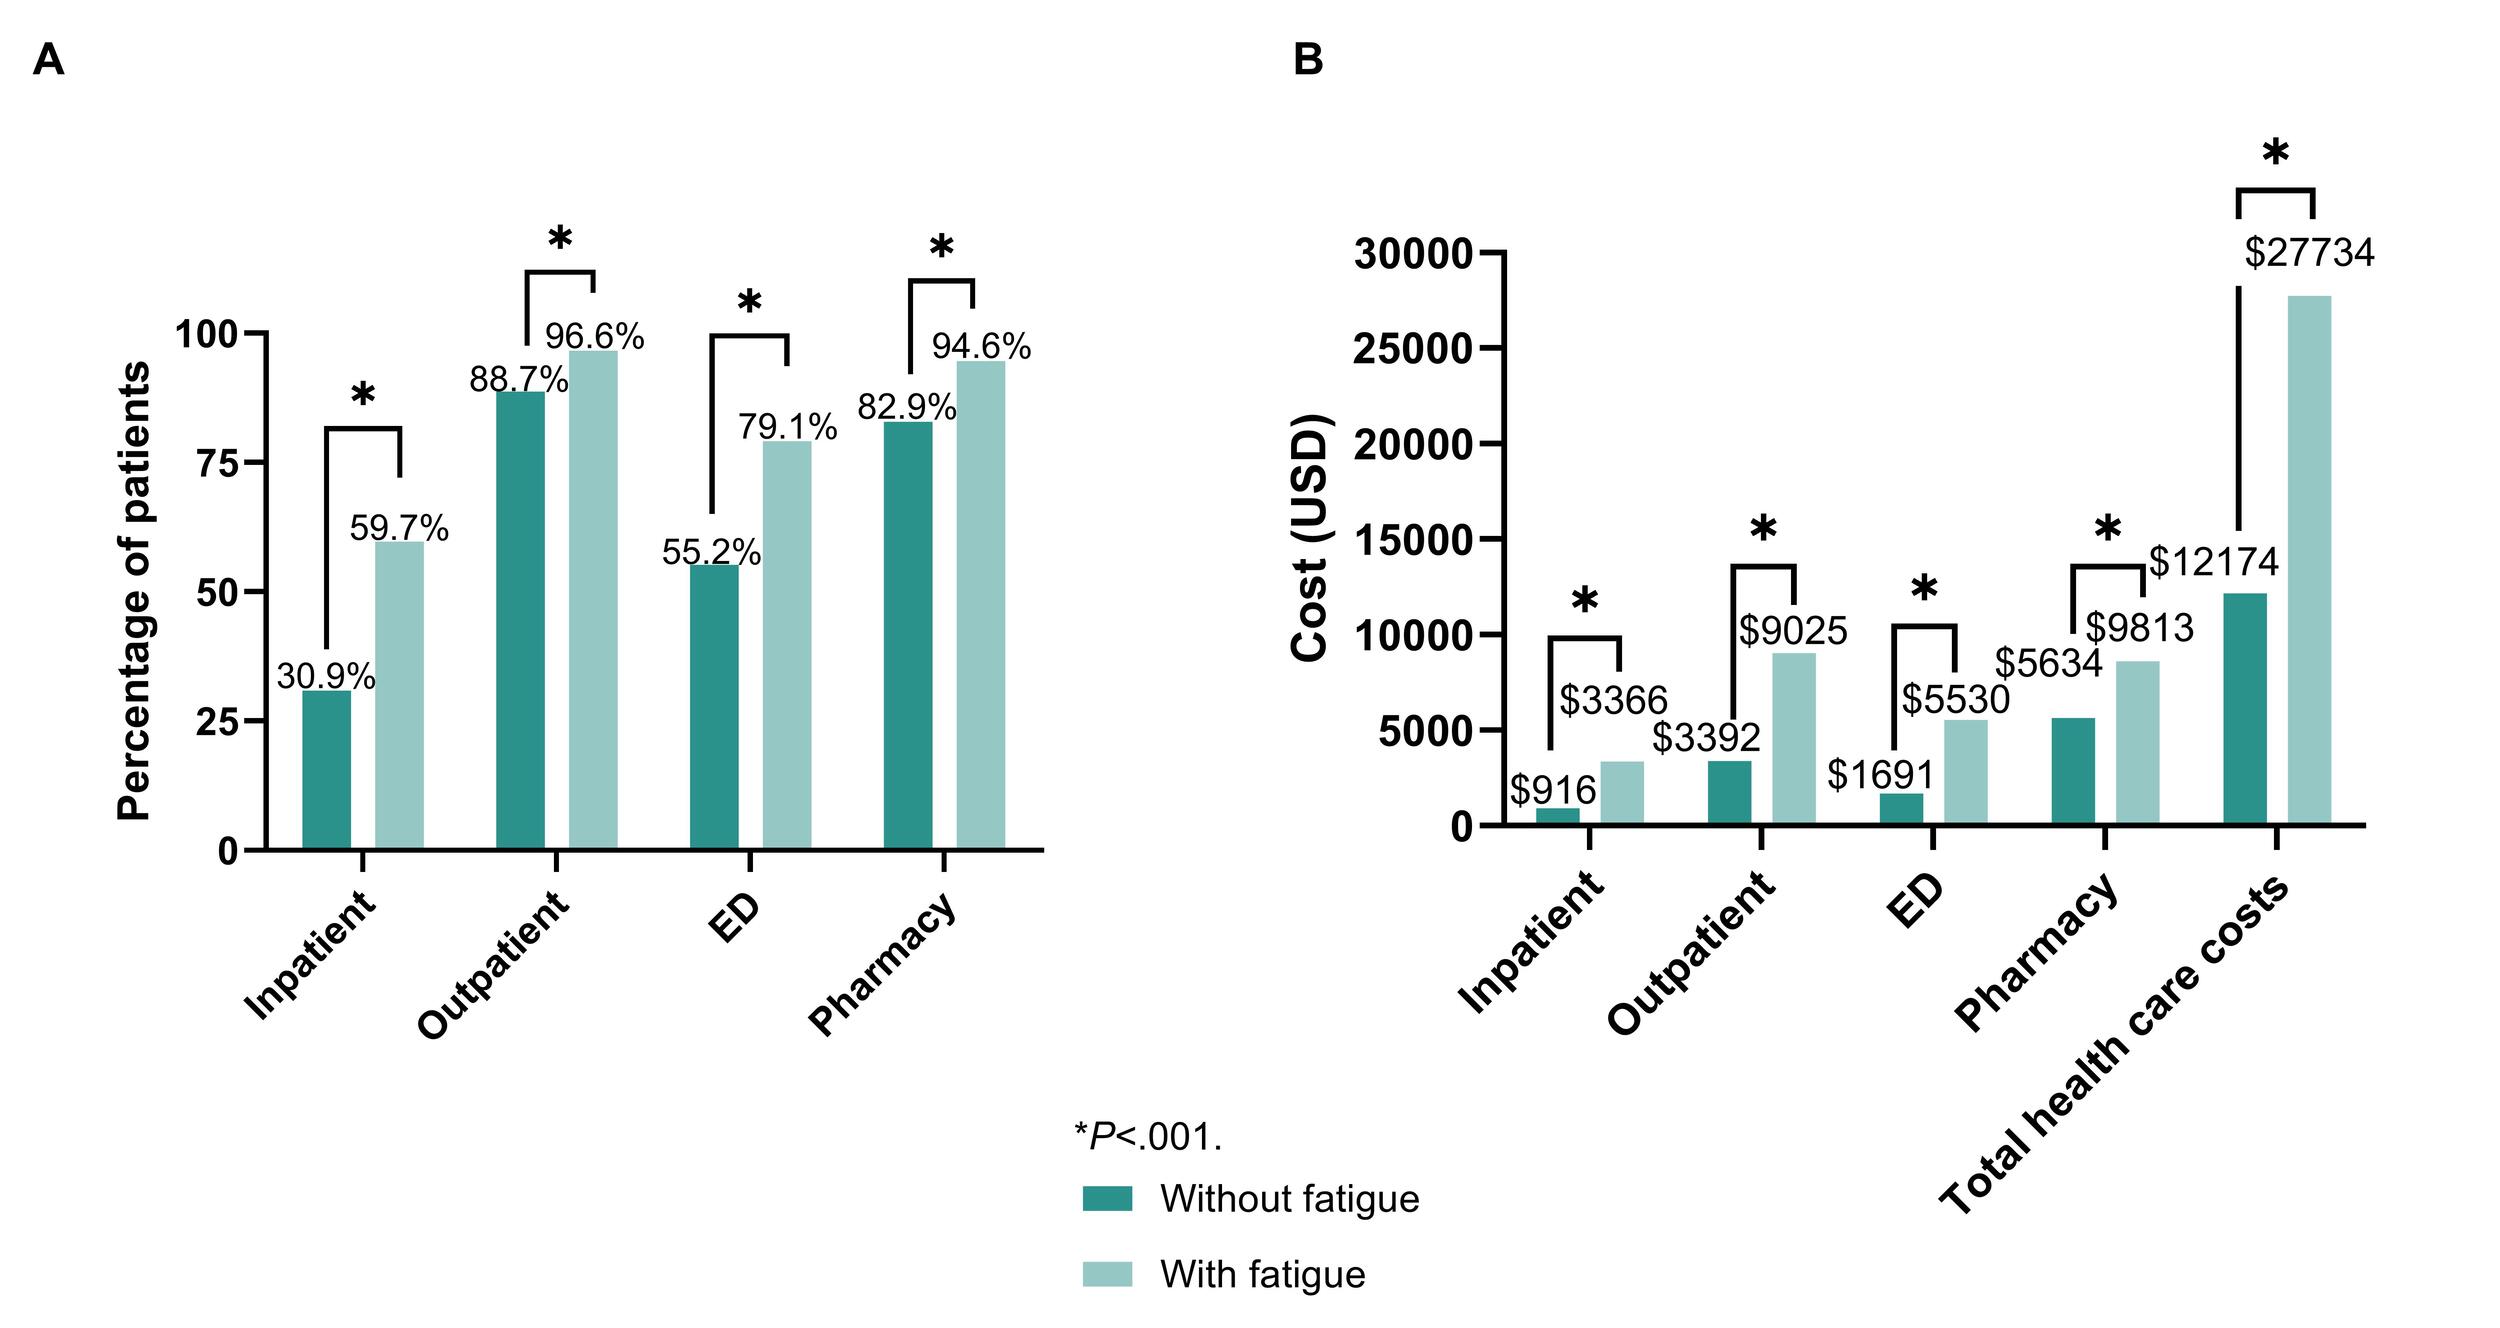
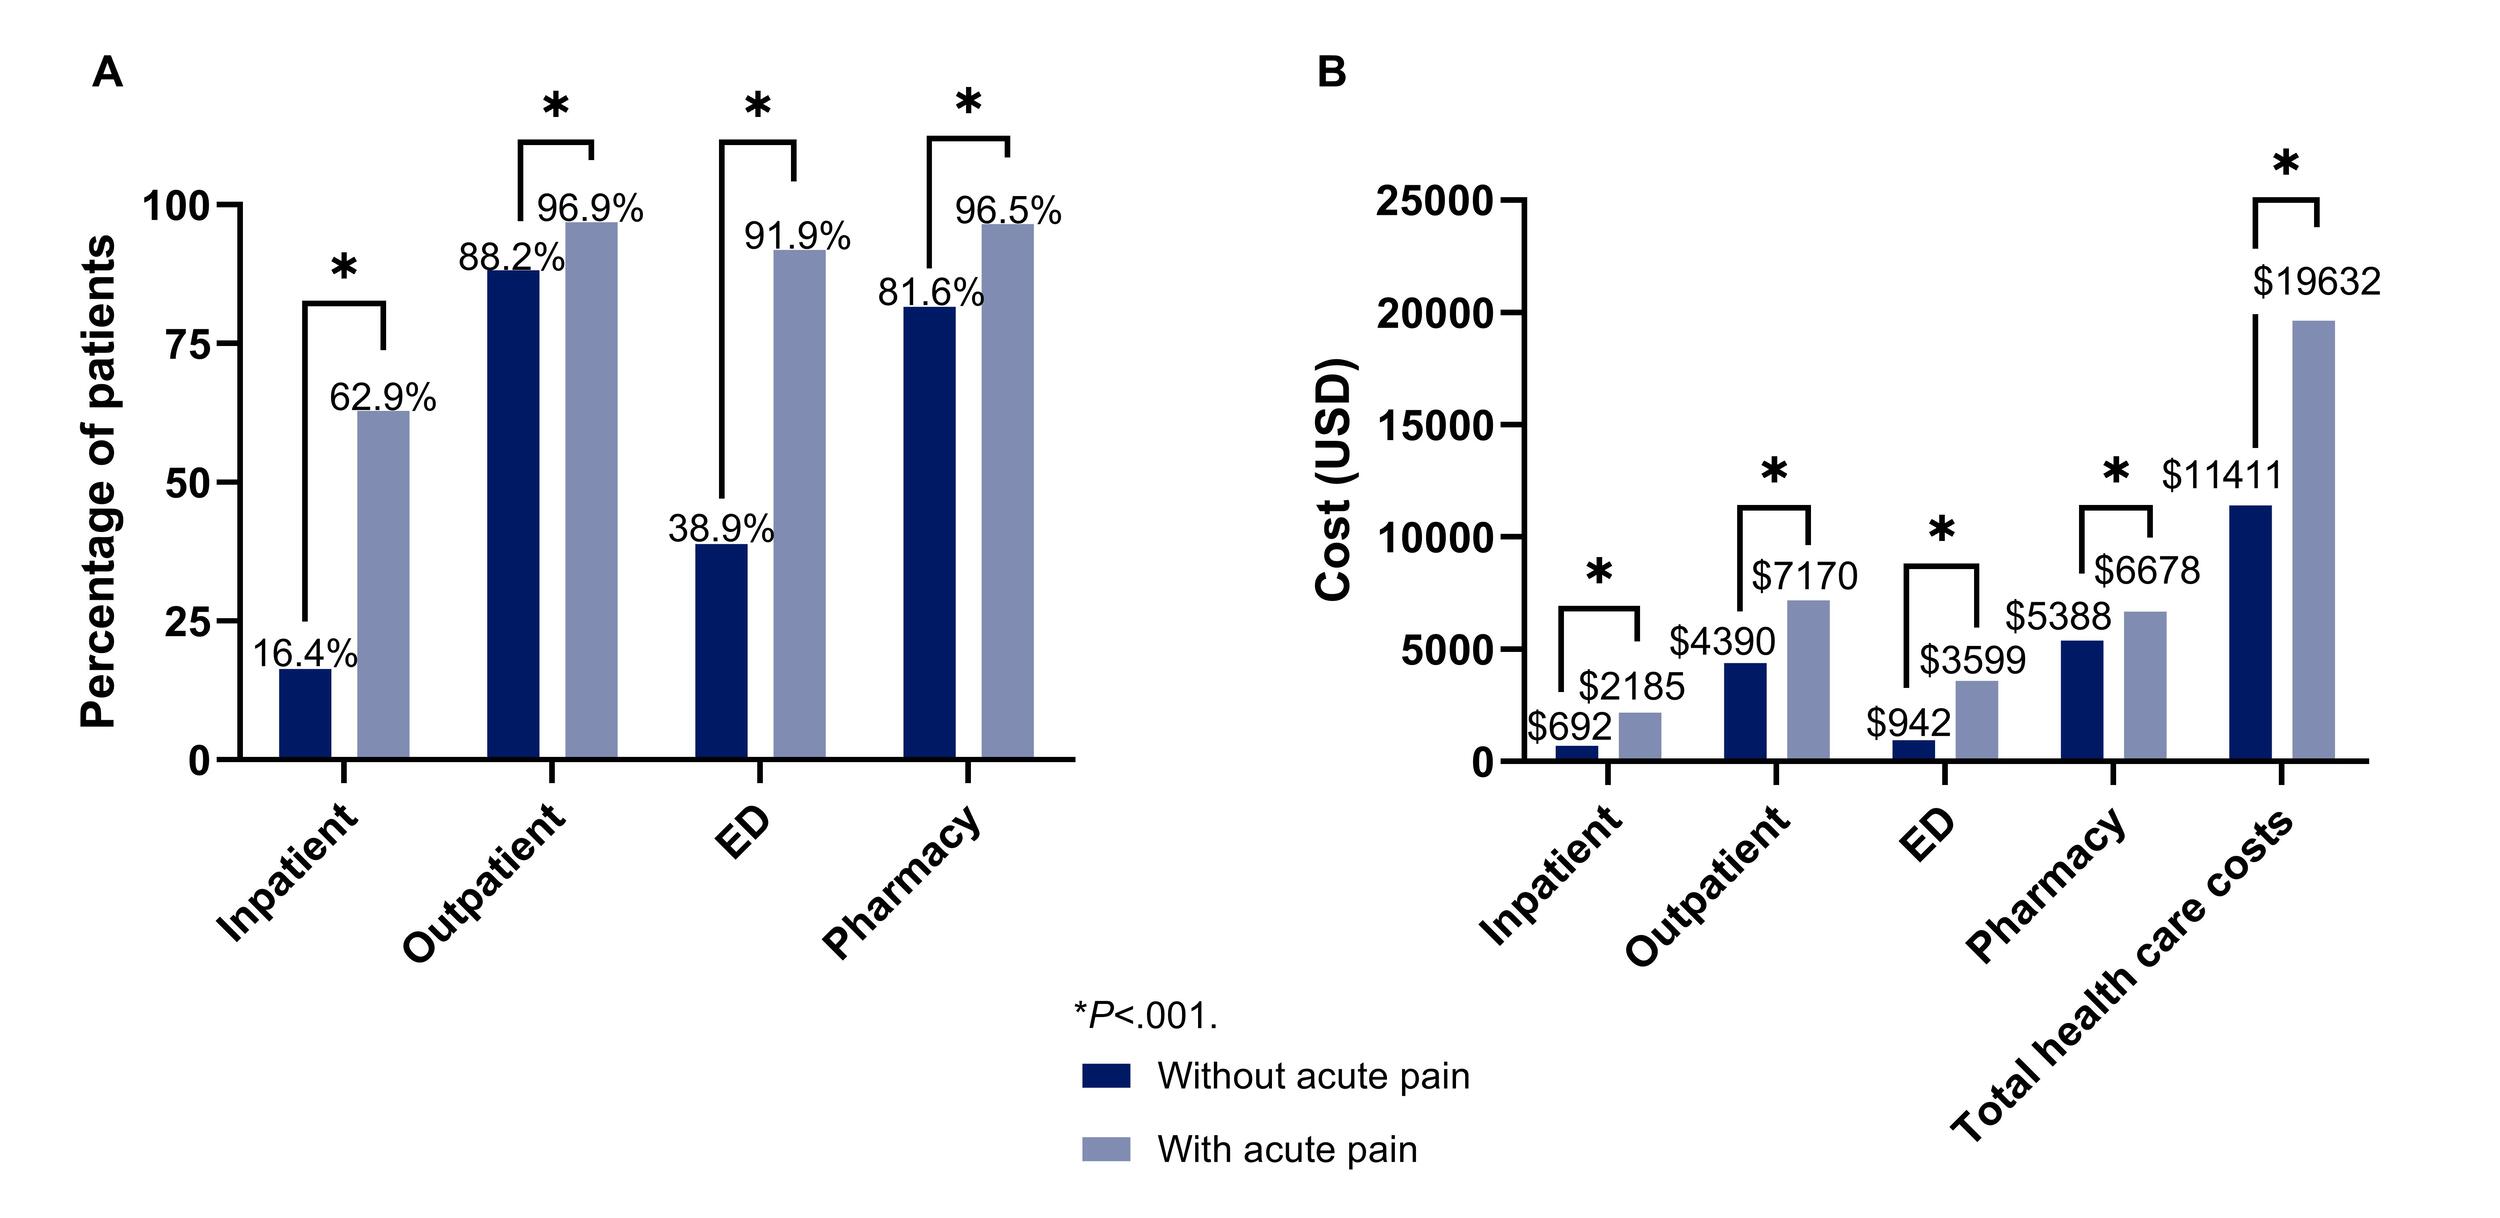
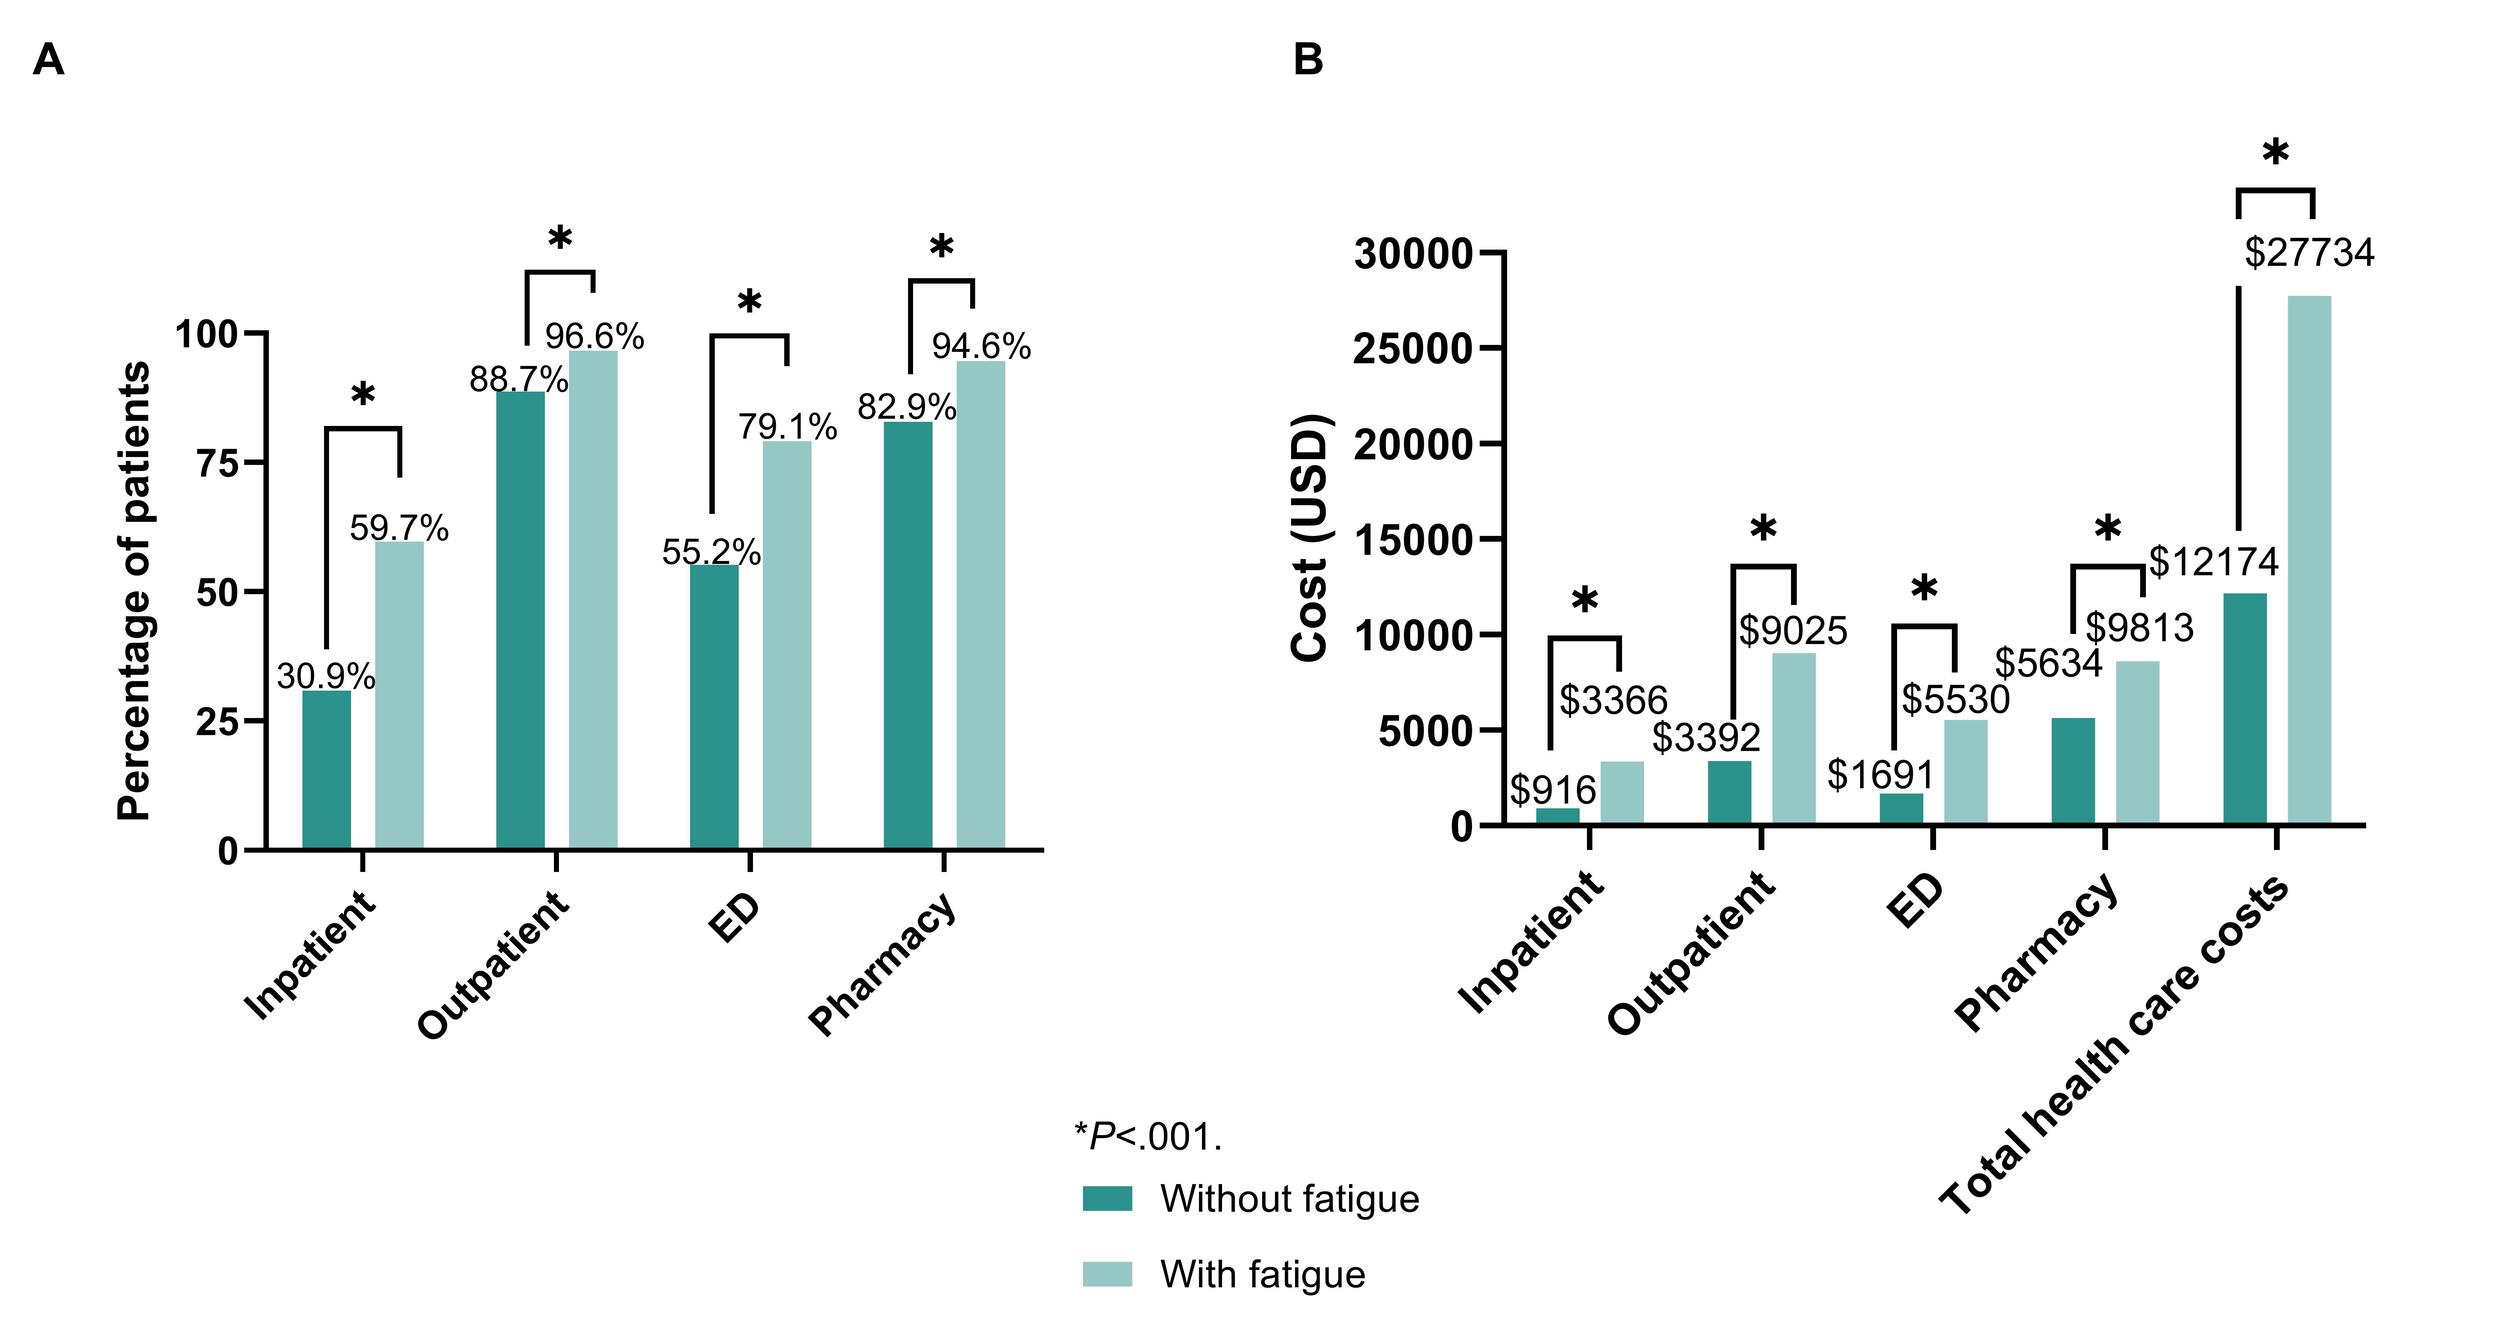
Similarly, 12-month unadjusted all-cause HCRU was significantly higher during the postindex period in patients with acute pain and in patients with fatigue than in their respective control groups (Figures 2A and 3A, respectively). In both cohorts, these differences were most pronounced in the inpatient (62.9% vs 16.4% for acute pain; 59.7% vs 30.9% for fatigue; all P < .001) and ED (91.9% vs 38.9% for acute pain; 79.1% vs 55.2% for fatigue; all P < .001) settings. Similar to the acute pain and fatigue cohort, unadjusted all-cause costs were significantly higher for patients with acute pain and for patients with fatigue than for their respective control groups (Figures 2B and 3B, respectively). For both cohorts, these differences were most pronounced in outpatient and ED costs, followed by inpatient and pharmacy costs. This resulted in a 72% increase in unadjusted total healthcare costs for those with acute pain vs those without ($19 632 vs $11 411; P < .001) and a 130% increase for those with fatigue vs those without ($27 734 vs $12 174; P < .001).
Results from the sensitivity analyses in which fatigue was defined solely by ICD-10-CM diagnosis codes remained consistent with the full sample (Supplemental Table S1). Costs were $8166 higher for patients with fatigue than for those without and appeared to be driven by increased utilization across healthcare settings.
The exploratory analyses assessed unadjusted HCRU and costs specific to acute pain and fatigue, acute pain alone, and fatigue alone. By definition, HCRU and costs specific to acute pain or fatigue were not observed among controls in the respective cohorts. Patients with both acute pain and fatigue, acute pain, or fatigue, had significantly higher rates of non–acute pain–specific or non-fatigue-specific HCRU compared with controls (all P < .001). Differences in unrelated HCRU between cases and controls were most pronounced in ED (acute pain and fatigue, 41.1%; acute pain, 25.8%; fatigue, 23.1%) and inpatient (acute pain and fatigue, 40.2%; acute pain, 23.6%; fatigue, 28.8%) settings (Supplemental Figures S5A, S6A, and 7SA).
Acute pain– or fatigue-specific utilization rates were 62.0%, 6.0%, 78.0%, and 74.8% for inpatient, outpatient, ED, and pharmacy settings, respectively. Acute pain–specific utilization rates were 48.9%, 85.8%, and 86.3% for inpatient, ED, and pharmacy settings, respectively. Fatigue-specific utilization rates were 1.3%, 11.0%, and 6.3% for inpatient, outpatient, and ED settings, respectively. Additionally, costs that were not directly associated with acute pain and/or fatigue were significantly higher among patients with both acute pain and fatigue, acute pain, or fatigue compared with controls (Supplemental Figures S5B, S6B, and S7B).
Results from the sensitivity analyses examining total costs using generalized linear models with a log-link and gamma distribution were consistent with the main results and demonstrated incremental total costs of $14 653, $7329, and $6865 for the main effects of both acute pain and fatigue, acute pain, and fatigue, respectively.
Adjusted HCRU and Costs
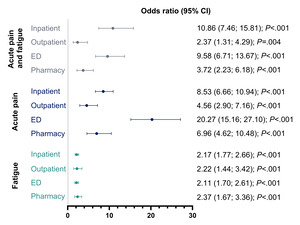
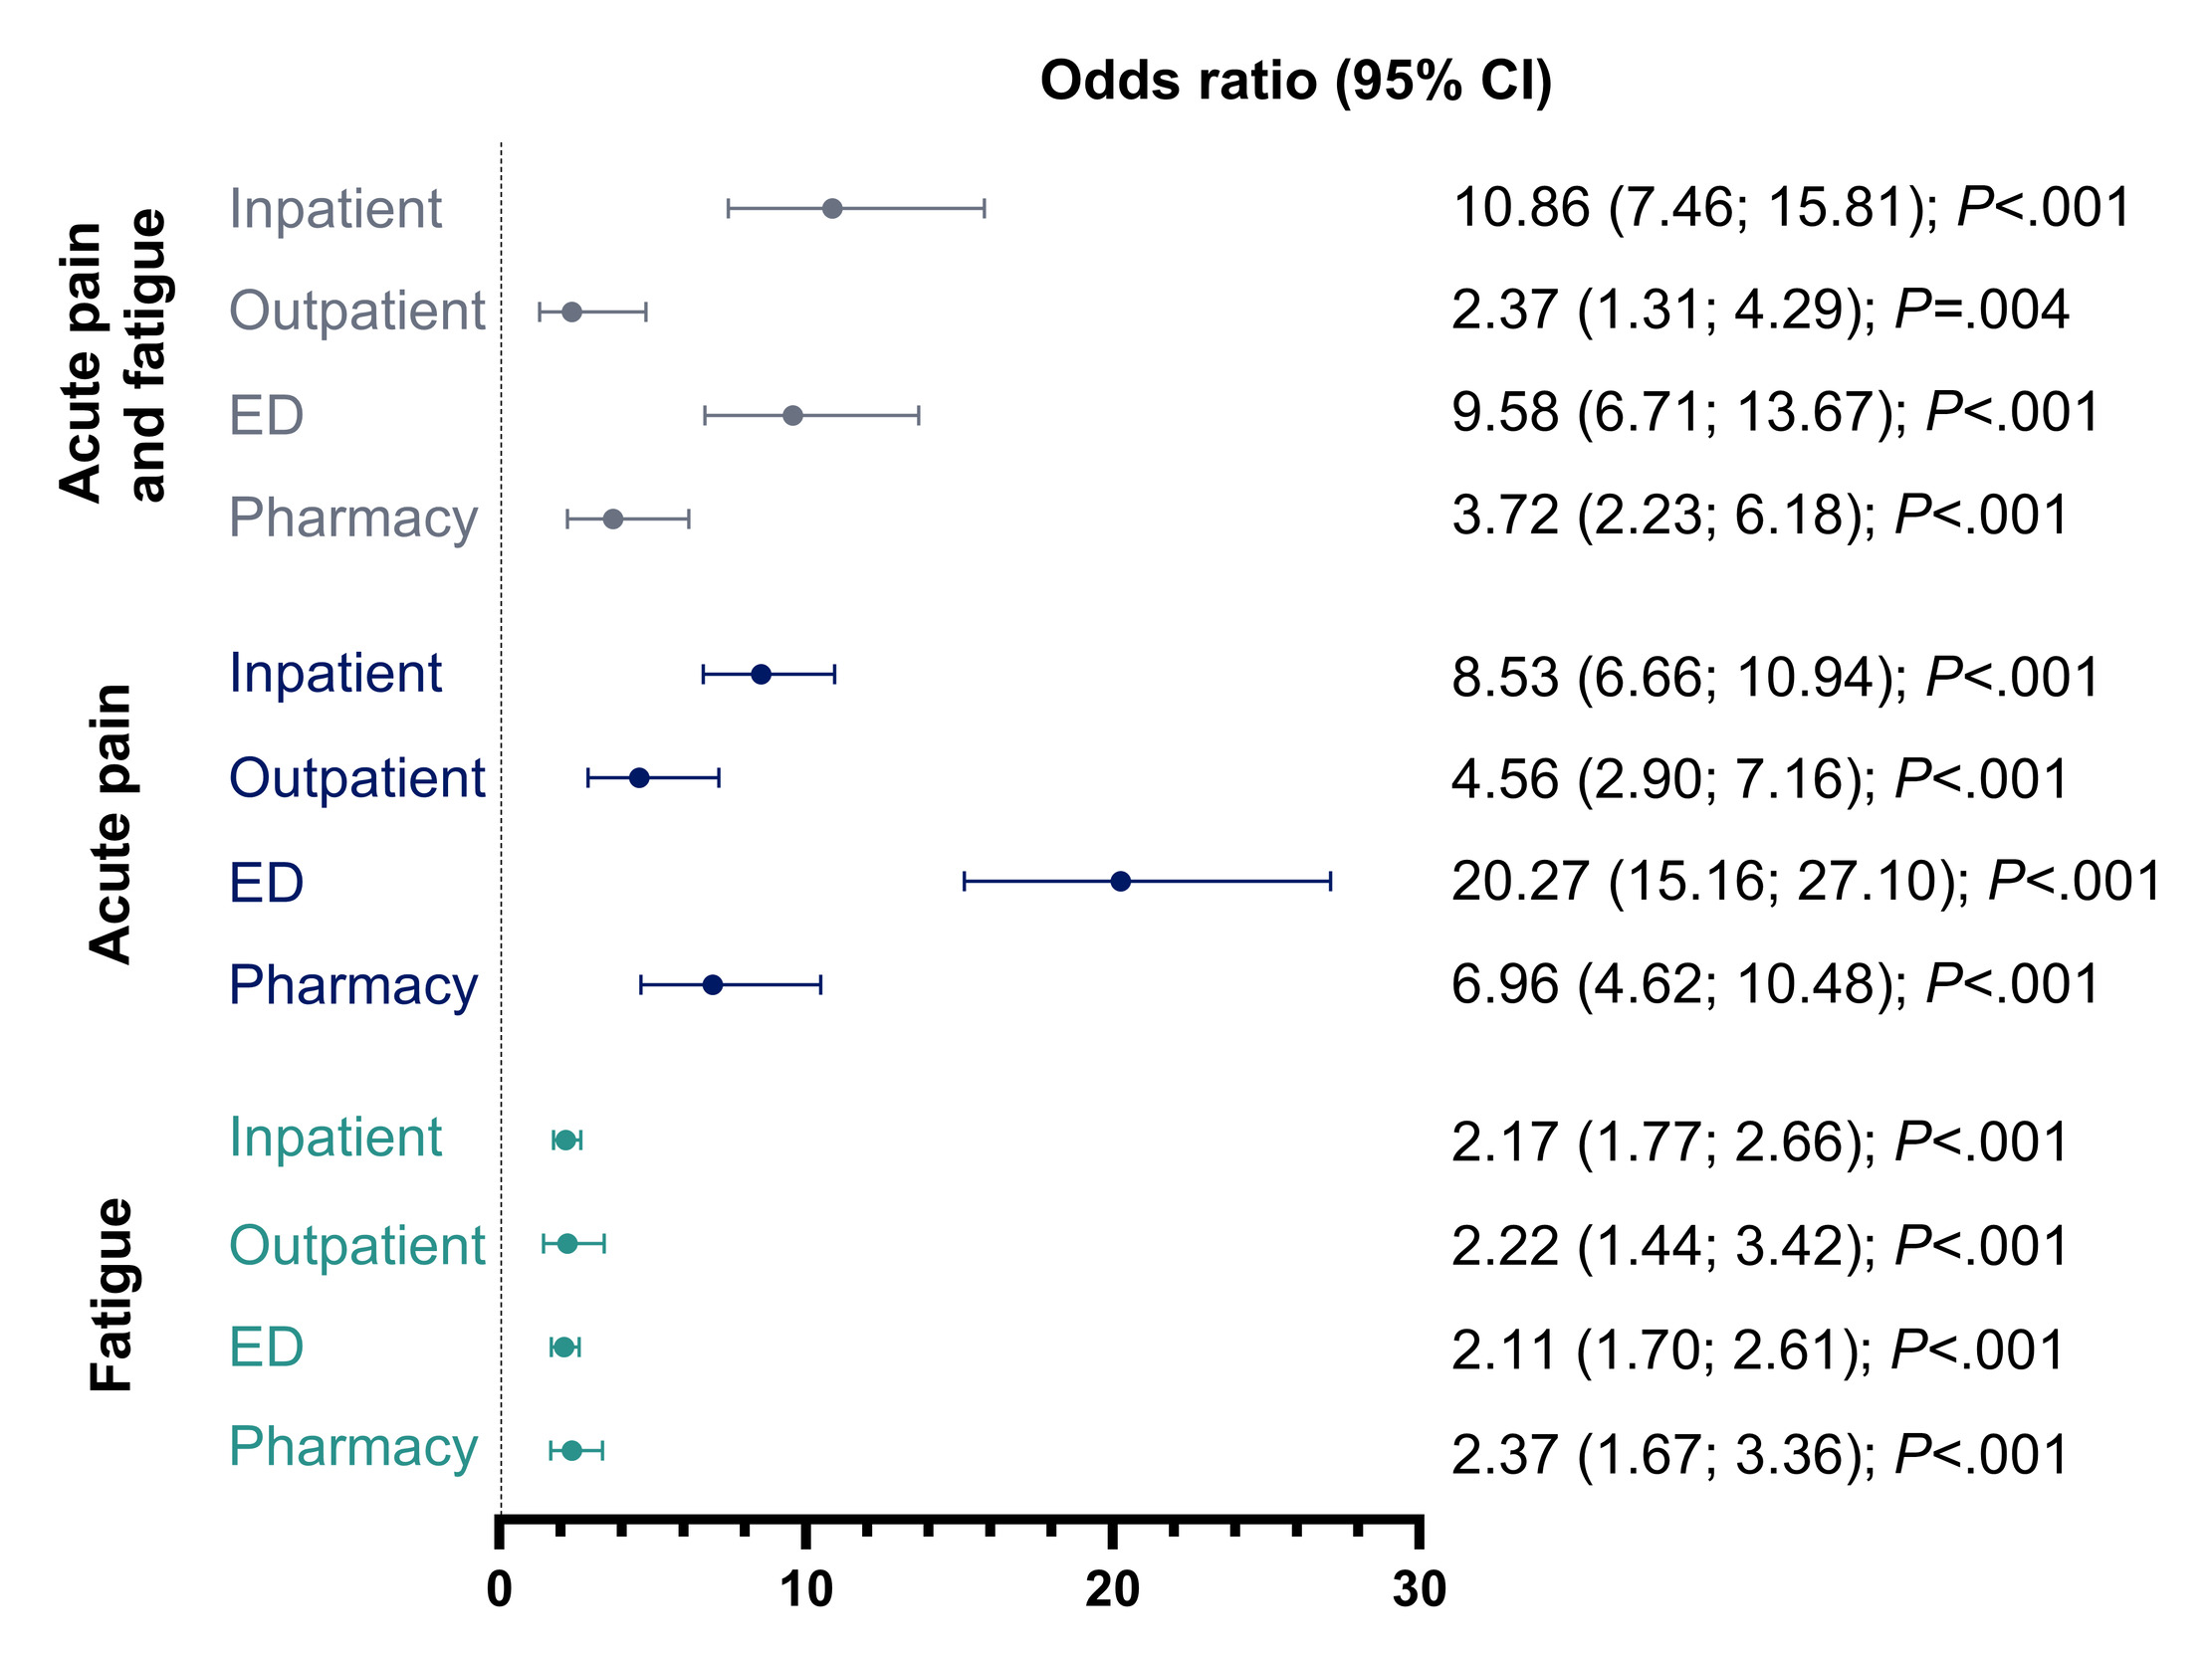
After adjusting for baseline demographic and clinical characteristics, patients with both acute pain and fatigue had a much greater probability of inpatient, outpatient, ED, and pharmacy utilization than patients without acute pain or fatigue (Figure 4). Similarly, patients with only acute pain or only fatigue had a much greater probability of HCRU across all settings compared with those without acute pain or fatigue. Among patients with both acute pain and fatigue, there was an associated $7689 increase in 12-month adjusted all-cause costs compared with patients without acute pain or fatigue (Table 2). Other significant demographic and clinical predictors of higher adjusted all-cause costs included history of transfusions, COPD, and sepsis. Older age (≥65 years) was associated with lower costs compared with younger age (18-24 years).
Similar cost associations were observed when acute pain and fatigue were assessed separately. Twelve-month adjusted all-cause costs were $6108 and $7500 higher in the acute pain and fatigue cohorts, respectively, compared with their respective controls. In both cohorts, older age (≥65 years) was associated with lower costs compared with younger age (18-24 years). Hb-SD genotype (compared with Hb-SS genotype), a history of transfusions, COPD, and sepsis were associated with higher adjusted all-cause costs in both the acute pain and fatigue cohorts. In the fatigue cohort, anxiety or depression at baseline was also associated with higher costs, and Hb-SC genotype was associated with lower costs (compared with Hb-SS genotype).
DISCUSSION
This study aimed to better understand the economic impact associated with acute pain and fatigue among patients with SCD. Our findings demonstrate the substantial economic burden associated with these symptoms among patients with SCD in the United States and improve understanding of the drivers of cost and HCRU among patients with SCD. High HCRU and costs associated with SCD have been previously reported, but the economic burden specifically associated with the hallmark SCD symptoms of acute pain and fatigue has not been as thoroughly examined.6,12,13 For example, one study found that compared with patients without SCD, mean total costs per patient per year were $28 601 and $35 028 higher for pediatric and adult patients with SCD, respectively.6 This study also found that HCRU ranged from 1.5 to 45.8 times higher for patients with SCD compared with patients without SCD.6 Mean total costs for patients with SCD reported in previous studies ranged from $28 601 to $77 321 and $19 194 for a 6-month period.6,12,13 These costs are in line with those observed in our study among patients with acute pain and fatigue symptoms while costs for patients without these symptoms in our study are significantly lower. This suggests that acute pain and fatigue may be large drivers of SCD-related costs. Additionally, a high economic burden persists over follow-up periods of up to 5 years across patient age groups, highlighting the lifetime cost of this disease.6,12 It has also been shown that patients experience a high economic burden despite availability of disease-modifying therapies such as hydroxyurea.13 Use of these therapies in the current study was low, ranging from 0% to 39.8%, but is in line with previous reports, with hydroxyurea use ranging from 25.5% to 54.8%.6,12 Limited use of disease-modifying therapies may contribute to the high economic burden observed in the current and previous studies and suggests an unmet need in access to disease modifying therapies. Findings from the current study also demonstrate the significant costs associated with fatigue, which may not be apparent when considering this symptom in a clinical setting.
The presence of both acute pain and fatigue, acute pain alone, or fatigue alone was associated with a substantially greater probability of HCRU. Large between-group differences were observed across care settings, including inpatient, outpatient, ED, and prescription medications. Higher rates of HCRU not specific to acute pain and/or fatigue observed in this study may be driven by physical and mental health comorbidities that often co-occur among patients experiencing pain and fatigue, such as sleep disruptions, obesity, anxiety, depression, and substance use disorders.14–18 Importantly, given that >50% of patients with SCD experience pain and >80% experience fatigue, the control cohorts may likely include patients who have pain and fatigue, but these symptoms were missed in claims and thus not recorded. Such misclassification may have led to a conservative estimate of the incremental effects of acute pain and fatigue .4,5 However, covariates that reflect and/or correlate with disease severity, including baseline CCI score, other SCD-related comorbidities, baseline treatments, and SCD genotype were adjusted for in the regression models.
While published information on the economic burden specific to SCD-related pain is limited, our findings are in line with previous studies that have examined the overall economic burden of SCD. Patients with SCD who experience recurrent vaso-occlusive crises (which contribute to SCD-related pain) incur higher annual and lifetime healthcare costs, compared with patients without SCD, and experience a moderate to high financial burden due to out-of-pocket expenses.7,19 While the focus of this study was the direct medical costs of acute pain and fatigue, SCD has also been associated with high indirect costs due to factors such as lost work, absenteeism, and loss of work productivity.20 SCD symptoms, such as acute pain and fatigue, contribute to these indirect costs and may impact career trajectory.20 This study highlights the need for treatments that better address these symptoms and further demonstrates the unmet needs among patients with SCD, including access to disease modifying therapies. Additionally, our study demonstrates the need for clinicians to focus on management of acute pain and fatigue when treating patients with SCD.
Limitations
As with all observational studies based on claims data, unmeasured confounding, missing data, loss to follow-up, and measurement error may have introduced bias and limited the ability to establish causal relationships. These limitations are mitigated through use of multivariable regression models, but unmeasured confounding may remain. Additionally, the definitions of acute pain and fatigue may have affected outcomes. This study focused on acute pain crises, which may not capture milder pain. The definition of fatigue included ICD-10-CM diagnostic codes, which are underutilized in patients with SCD and may be limited to those who are experiencing severe levels of fatigue. The inability to capture mild pain and fatigue may have resulted in overestimation of the incremental HCRU and costs. Conversely, a potential misclassification in which cases with milder pain and/or fatigue were classified as controls may have led to underestimation of the incremental HCRU and costs. In the acute pain cohort, the high odds ratios of ED utilization associated with acute pain cannot be meaningfully interpreted, as they are partly due to the definition of acute pain, which includes ED utilization. Costs specific to acute pain were limited to those defined by an expanded Singh algorithm (costs associated with inpatient/ED encounters including opioid prescriptions within 7 days after the respective inpatient/ED encounter); therefore, costs related to chronic pain or pain episodes not meeting this definition may have been classified as costs not specific to acute pain.10
Fatigue was also captured using the National Cancer Institute gradings of life-threatening (Hb <6.5 g/dL), severe (Hb 6.5-7.9 g/dL), or moderate (Hb 8.0-10.0 g/dL) anemia.11 This grading may not always accurately reflect underlying fatigue. For fatigue cases classified by Hb levels alone, utilization with a primary diagnosis of fatigue may have led to a conservative estimate of the incremental effect of fatigue. Alternatively, given that patients with the HbSS genotype of SCD often have Hb levels <10.0 g/dL even if they do not experience fatigue, use of Hb levels to define fatigue may have led to overclassification of fatigue among patients with this genotype. To address this limitation, we conducted sensitivity analyses in which fatigue cases were defined solely by ICD-10-CM codes. Results remained consistent with those in the primary analyses. However, numerically greater HCRU and higher costs were observed across settings. This may have resulted from fatigue diagnoses based on ICD-10-CM codes, which likely captured patients with more severe fatigue. Therefore, this analysis provides further insight into the economic burden among patients with SCD who experience severe fatigue. Classification of SCD genotypes based on ICD-10-CM codes may be inaccurate due to errors in coding. Although SCD genotypes were not the primary focus of this study, their estimated effects on HCRU and costs should be interpreted with caution. Given that inpatient visits were part of the inclusion criteria—potentially inflating costs for the overall sample but not necessarily affect incremental costs—both patients with and without inpatient utilization within 12 months were included in analyses of average costs.
CONCLUSIONS
This study underscores the substantial and previously underrecognized economic impact of acute pain and fatigue in patients with SCD. By providing estimates of the cost and HCRU associated with these symptoms, this study offers valuable information that can be used for evaluating the value of new therapies. These findings highlight the need for novel, effective, and safe treatments to address the considerable unmet needs in managing pain and fatigue in SCD.
Acknowledgments
The authors would like to thank Amy Leach, PhD, of Precision AQ for writing and editorial assistance, funded by Novo Nordisk Inc. in accordance with Good Publication Practice guidelines.
Disclosures
J.V.C. and A.W. are employees of Novo Nordisk Inc.; M. Samnaliev, Y.P., and M. Sussman are employees of Stratevi; and SBis an employee of Genesis Research Group.
Funding
This work was supported by Novo Nordisk Inc.
Presentation
Some data included in this manuscript have been previously presented as posters at the Academy of Managed Care Pharmacy Nexus 2025 and the International Society for Pharmacoeconomics and Outcomes Research 2026 meetings. Abstracts resulting from these data have been published in Value in Health (doi:10.1016/j.jval.2026.03.799) and Blood (doi:10.1182/blood-2025-7969).