
BACKGROUND
Excluding non-melanoma skin cancer, prostate cancer is the most common cancer in men in the United States (US), with an estimated 299 010 new cases and 35 250 deaths in 2024.1 Although the prostate cancer death rate dropped by approximately half from 1993 to 2013 and has since plateaued,2 the overall incidence rate has been increasing by 3% per year, with a 5% annual rise in advanced-stage prostate cancer since 2014.1 Consequently, treatment costs for prostate cancer have been increasing rapidly in recent years and ranked as the second-highest out-of-pocket cost nationally in 2019, estimated at $2.26 billion.3 This rising economic burden places significant financial strain on both patients and the healthcare system. The burden is expected to increase further as more patients are diagnosed at advanced stages requiring intensive treatment and long-term care.4
In the US, localized and locally advanced prostate cancer (LPC), defined as a prostate cancer without distant metastasis, accounted for approximately 70% of prostate cancer cases at diagnosis.5 According to the National Comprehensive Cancer Network guideline, an LPC patient is considered high-risk if the Gleason score is at least 8, prostate-specific antigen (PSA) is at least 20 ng/mL, or the T stage is T3a and above.6 These high-risk LPC (HR-LPC) patients accounted for approximately 26% of newly diagnosed prostate cancer cases and are at increased risk for recurrence and disease progression following treatment.7 Due to their elevated risk, patients with HR-LPC often require more intensive treatments and follow-up, which may contribute disproportionately to overall healthcare utilization and costs.8,9
The most widely used initial definitive treatment options for LPC patients are external beam radiation therapy (EBRT) and radical prostatectomy (RP), with the median time from diagnosis to treatment initiation typically ranging from approximately 2 to 3 months.10–14 However, limited real-world evidence exists on the long-term economic burden following initial definitive treatment for LPC.
The objective of this study is to examine the healthcare costs among Medicare beneficiaries who were newly diagnosed with LPC and received EBRT or RP as their initial definitive therapy.
METHODS
Data Source
The study utilized data from the Surveillance, Epidemiology, and End Results (SEER)–Medicare database. The SEER program includes newly diagnosed cancer cases in up to 21 registry areas, covering approximately 30% of the US population.15 SEER collects detailed patient-level data, including demographics, cancer characteristics, survival outcomes, and socioeconomic status at the census tract level.16 Medicare is the largest healthcare payer in the US, providing insurance coverage for most individuals aged 65 years and older.17 Medicare claims offer longitudinal data on healthcare encounters, treatments, and associated costs.18 By linking cancer registries to Medicare claims, the SEER–Medicare database provides a comprehensive, population-level dataset that enables the analysis of real-world treatments, outcomes, and healthcare resource utilization and cost among cancer patients.
Study Design and Patient Selection
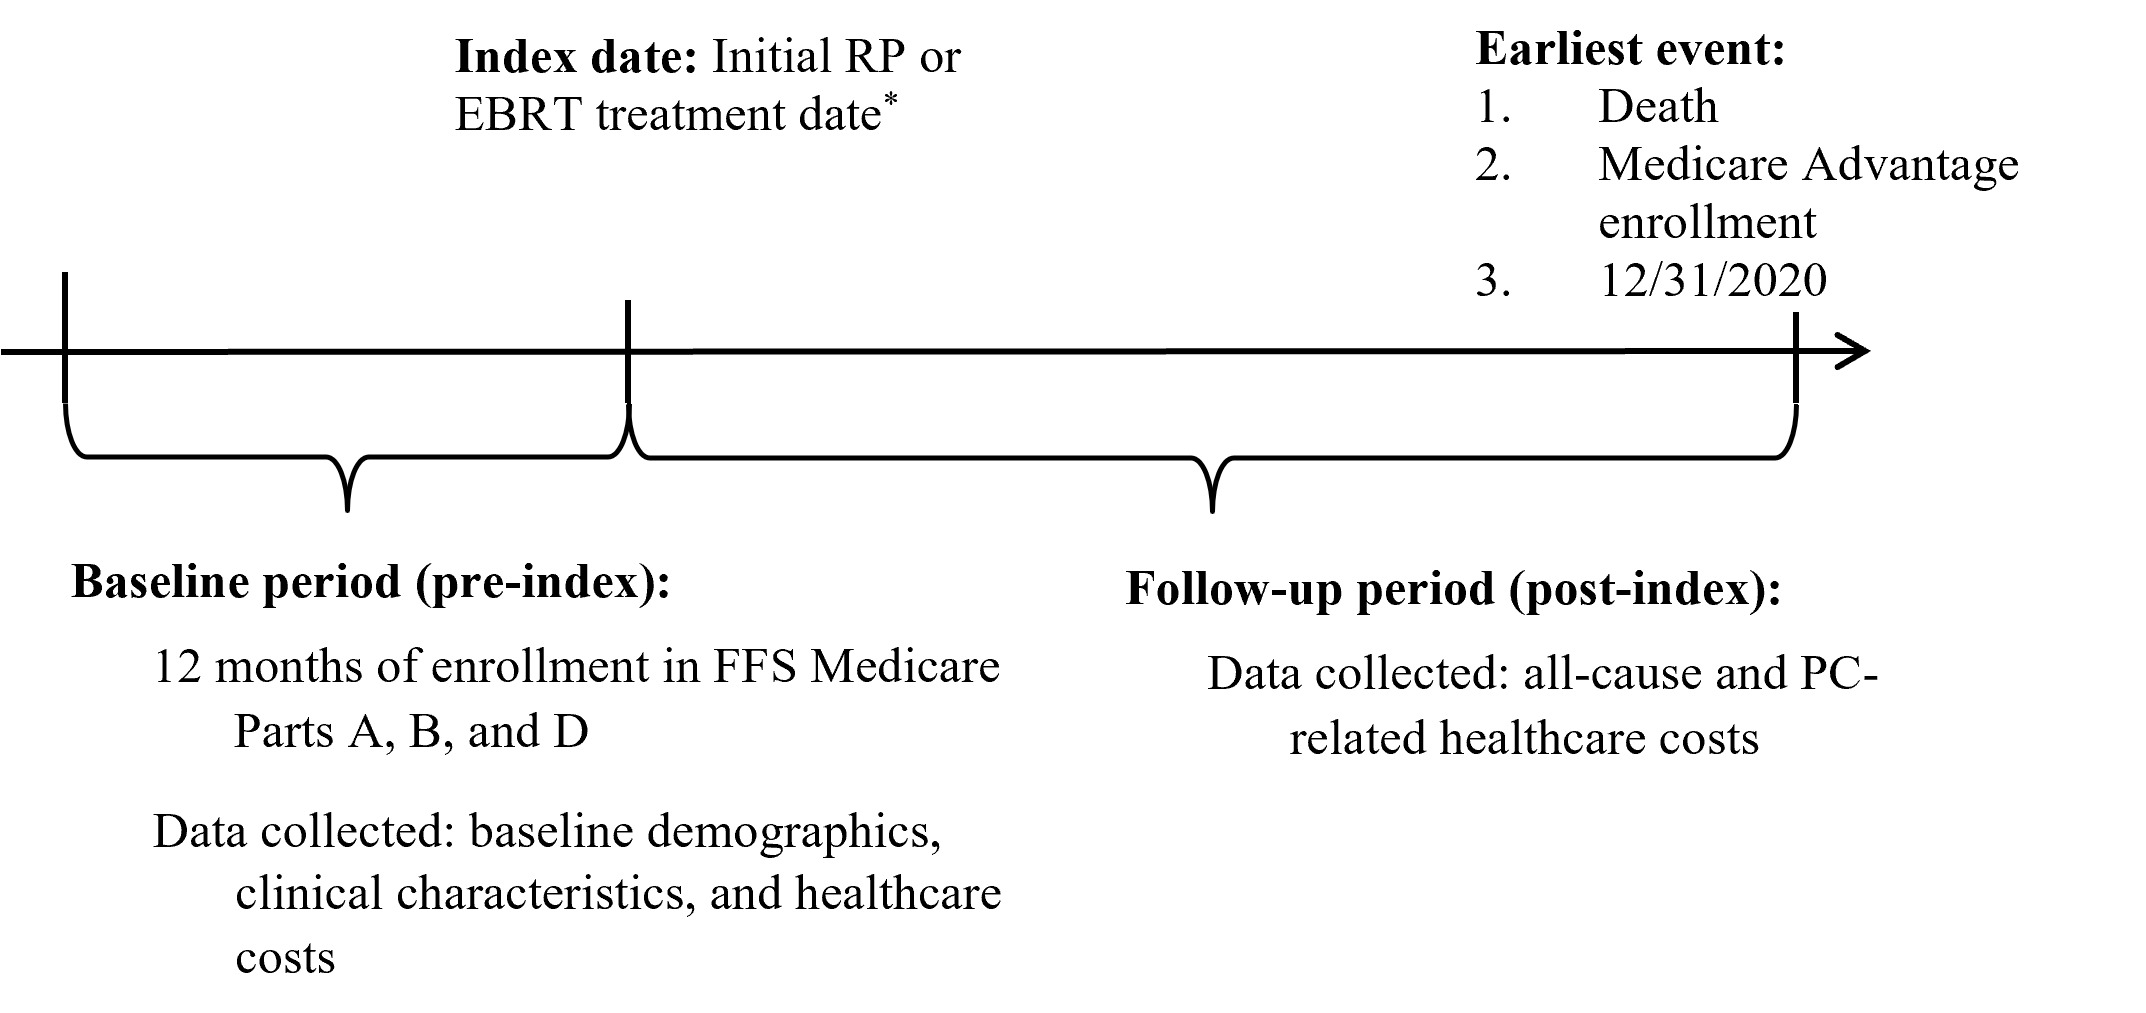
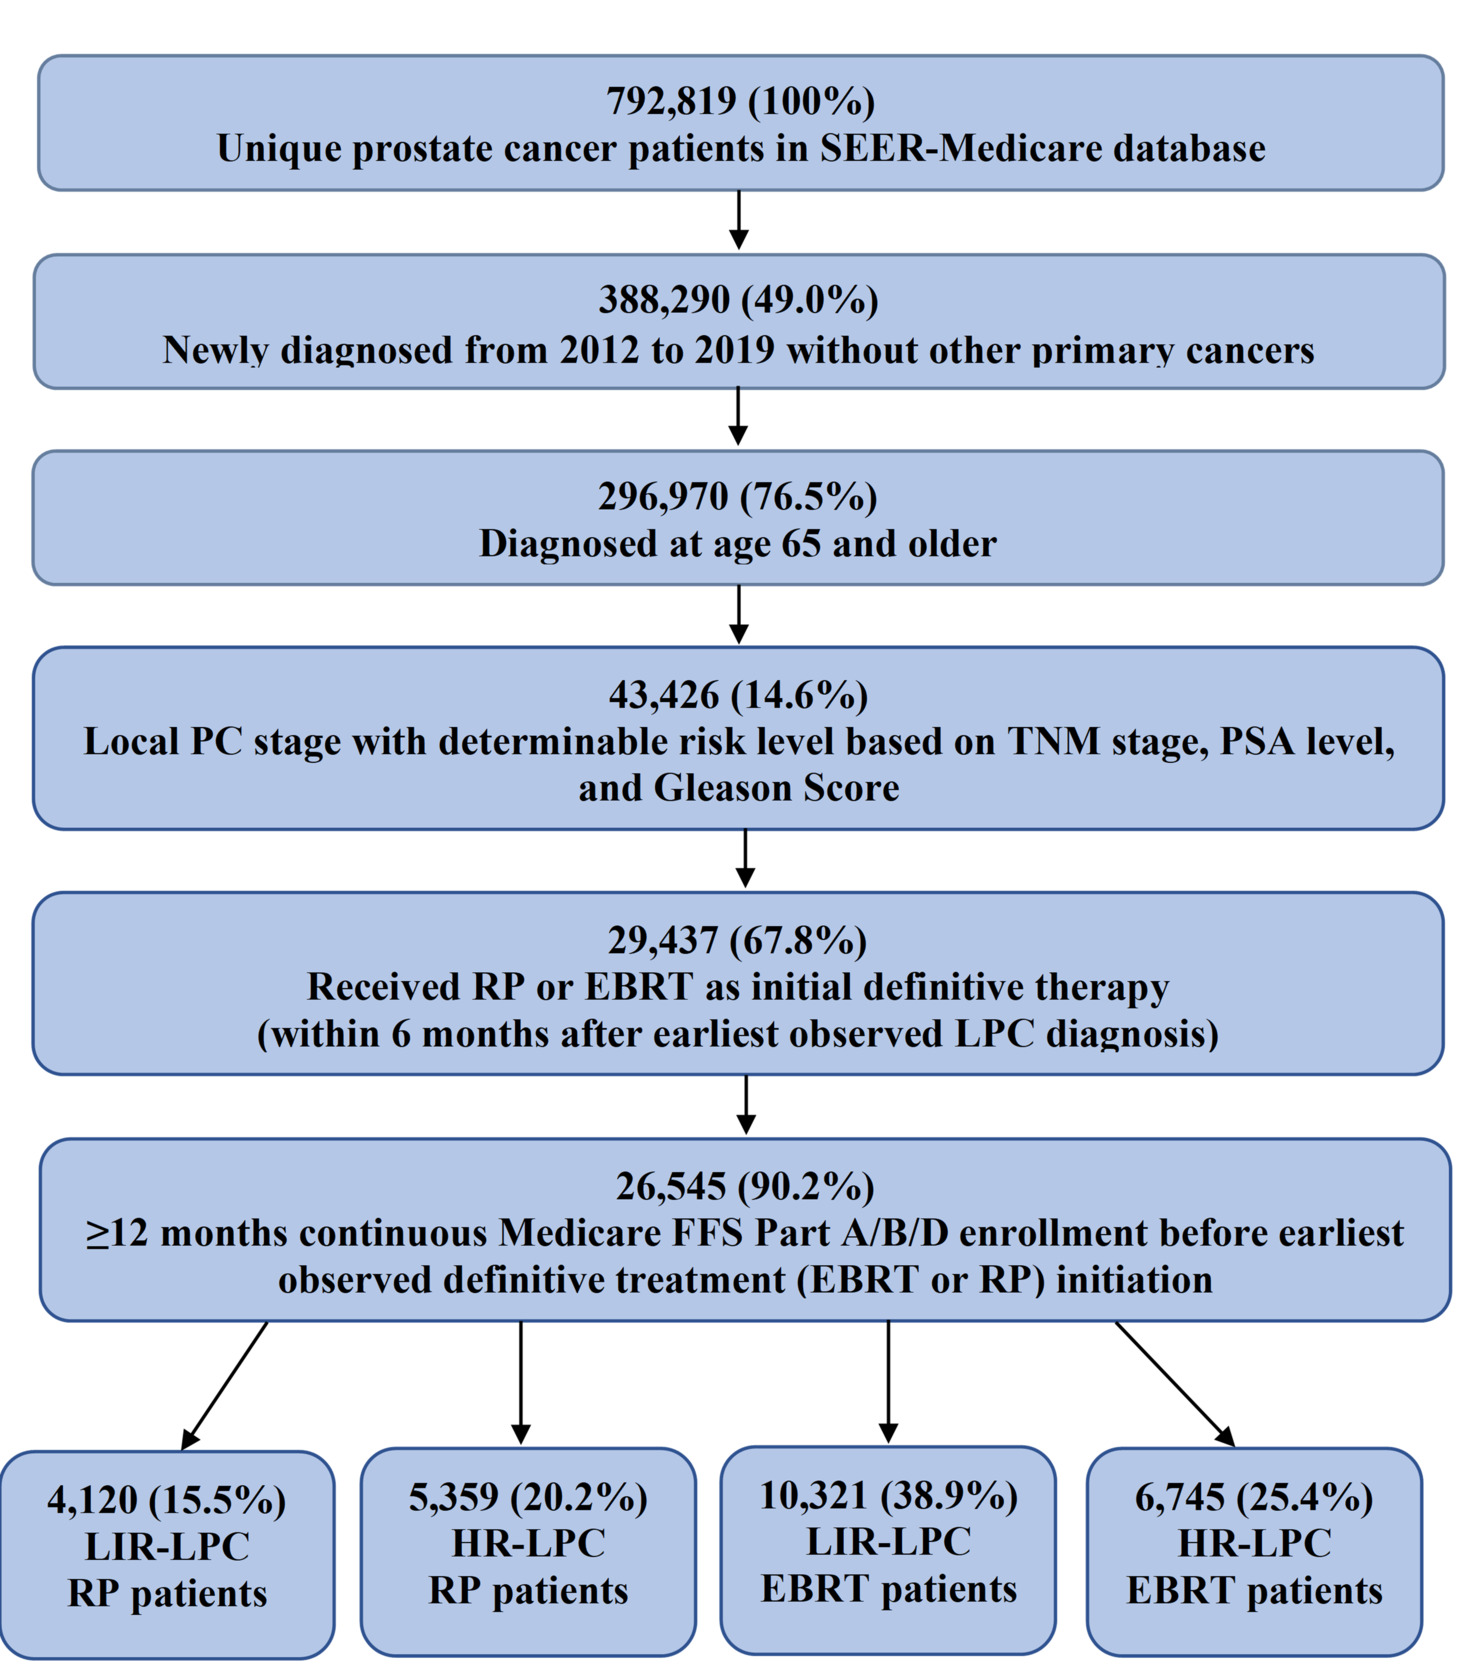
This was a retrospective, observational, cohort study. The patient selection process is illustrated in Figure 1. Patients aged ≥65 years with newly diagnosed LPC between 2012 and 2019 were eligible for inclusion. Patients with LPC were defined by TNM staging system as having a pelvic lymph node status of N0 or N1 and a metastasis status of M0. Eligible patients must have received either EBRT or RP as their initial definitive treatment within 6 months of diagnosis, as determined from Medicare claims. The cohort index date was defined as the earliest observed claim for definitive treatment. To ensure complete capture of treatment history, patients were also required to have continuous enrollment in Medicare Fee-For-Service Parts A, B, and D for ≥12 months prior to the index date (the baseline period). Patients were excluded if they had a history of other primary cancers, evidence of metastatic disease at diagnosis, indeterminate LPC risk classification, or received definitive prostate cancer treatment other than androgen deprivation therapy (ADT) before the index date.
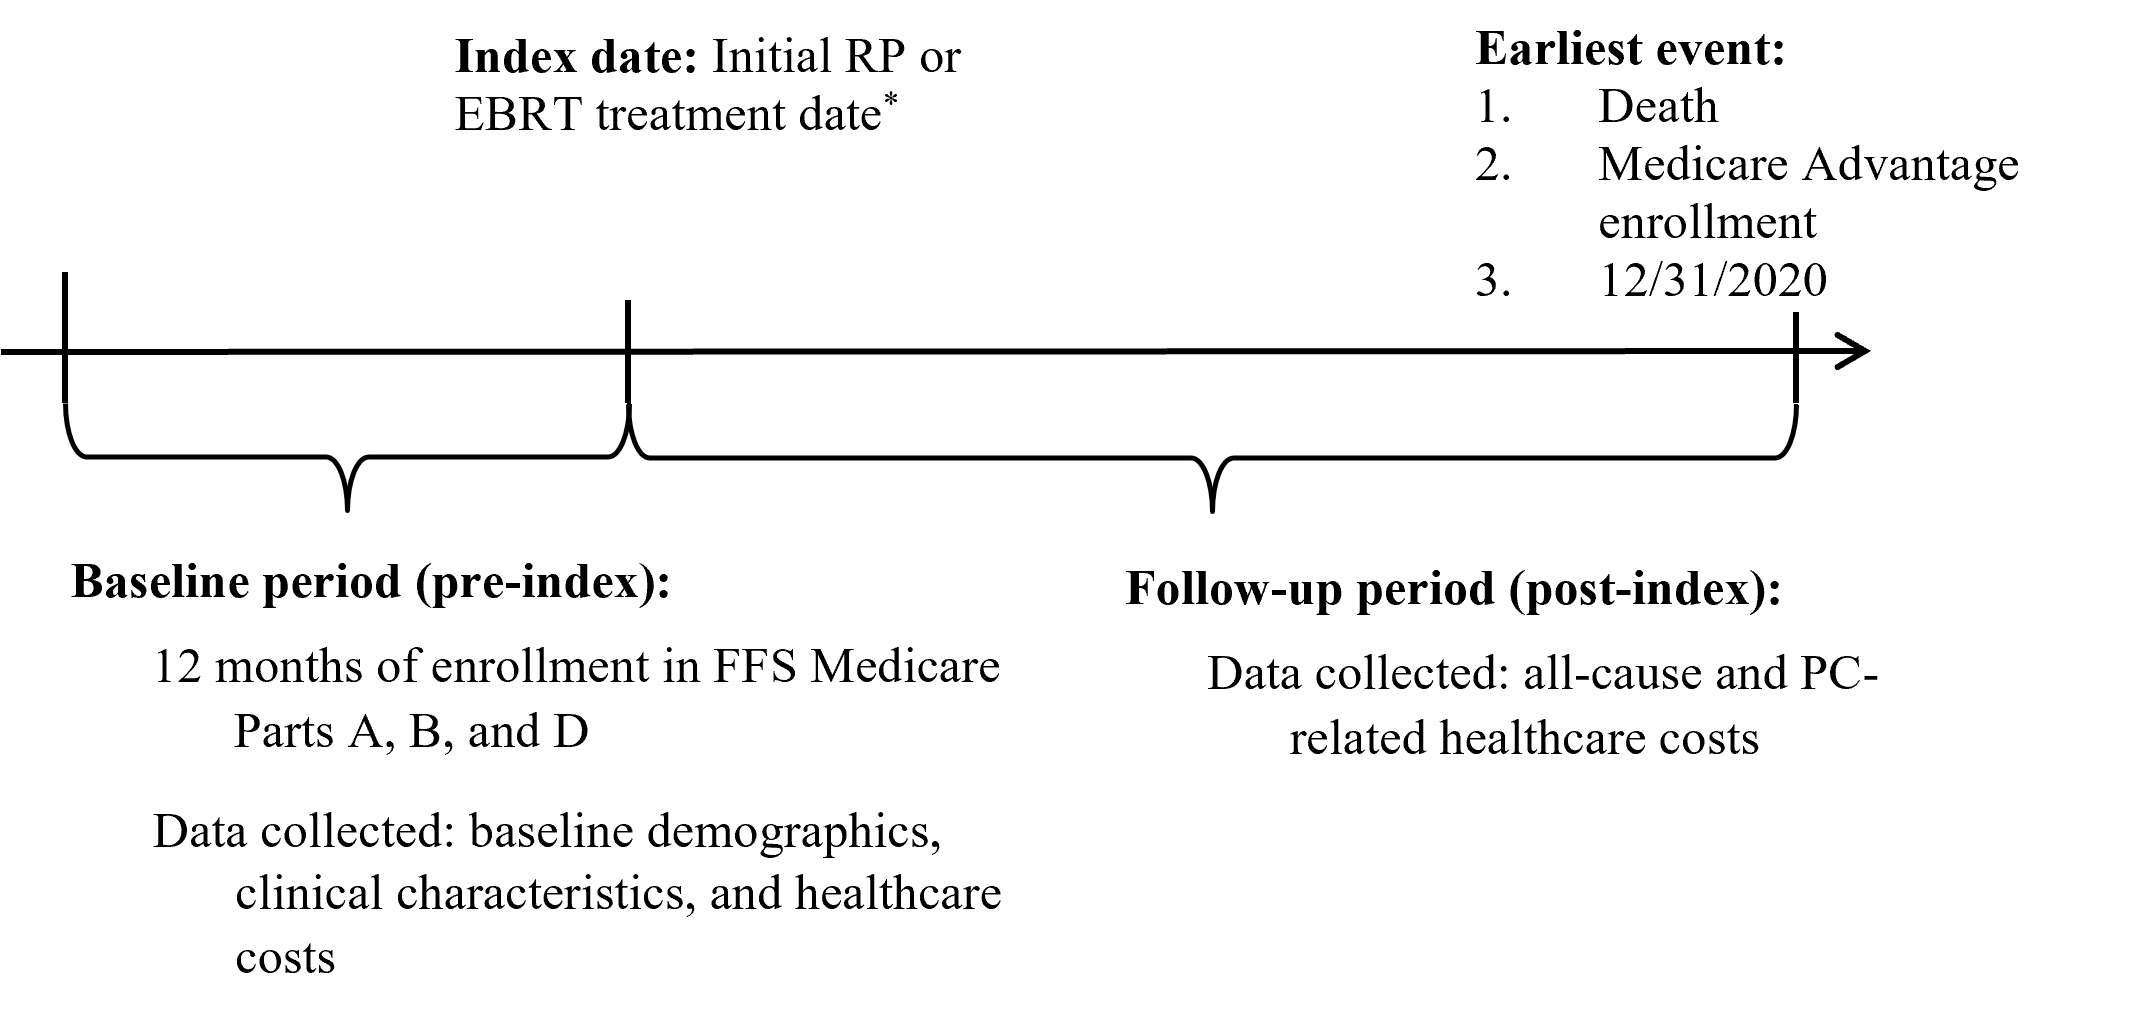
Patients were stratified into high-risk or low/intermediate-risk cohorts according to National Comprehensive Cancer Network criteria, based on T stage, Gleason score, and PSA level at diagnosis.6 All patients were followed for economic outcomes from the index date through the earliest event of death, disenrollment from Medicare Fee-For-Service Part A, B, or D, or the end of the study period (31 December 2020).
Patient Characteristics and Economic Outcomes
Patients’ sociodemographic and prostate cancer–related clinical characteristics were extracted from SEER CANCER files. These included age at the index date, sex, marital status, urban or rural residence, geographic region, and household income and education at the census tract level, as well as TNM stage, PSA results, Gleason score, and histology. Comorbidity burden was assessed during the 12-month baseline period prior to the cohort index date. The National Cancer Institute (NCI) Comorbidity Index was used, which captures 16 noncancer comorbid conditions based on diagnostic codes.19 The use of ADT during the baseline period was also extracted from Medicare claims using Current Procedural Terminology codes and Healthcare Common Procedure Coding System codes.
The primary outcomes of interest were post-index all-cause costs and prostate cancer–related costs from the Medicare payer perspective. The total costs were categorized according to Medicare claim type and included emergency department (ED), inpatient, outpatient, other (home health agency, hospice, and durable medical equipment), and pharmacy (Part D) costs. Prostate cancer–related drug costs were also analyzed separately, which included ADT, anti-androgens, poly ADP-ribose polymerase (PARP) inhibitors, other systemic therapies (chemotherapy, immunotherapy, and radium 223 dichloride), and bone metastasis treatments. Second-generation anti-androgens, PARP, and other systemic therapies were analyzed as treatments for advanced prostate cancer.
Statistical Analysis
All baseline characteristics (at first therapy initiation) were summarized using descriptive statistics. Categorical variables were reported as counts and proportions (%), and continuous variables were reported as means and standard deviations (SD). Cost outcomes were presented on a per-patient-per-year (PPPY) basis. All costs were adjusted to 2023 US dollars using the medical care component of the Consumer Price Index. Two-sample t-test was used to compare the mean healthcare costs between cohorts.
RESULTS
Baseline Patient Demographic and Clinical Characteristics
A total of 26 545 patients met the selection criteria and were stratified into 4 independent cohorts by risk classification of HR vs LIR and initial treatment of RP vs EBRT (Figure 2). Stratification by risk status was performed because disease risk influences treatment approaches and associated healthcare costs. Patient baseline demographic and clinical characteristics are summarized in Table 1.
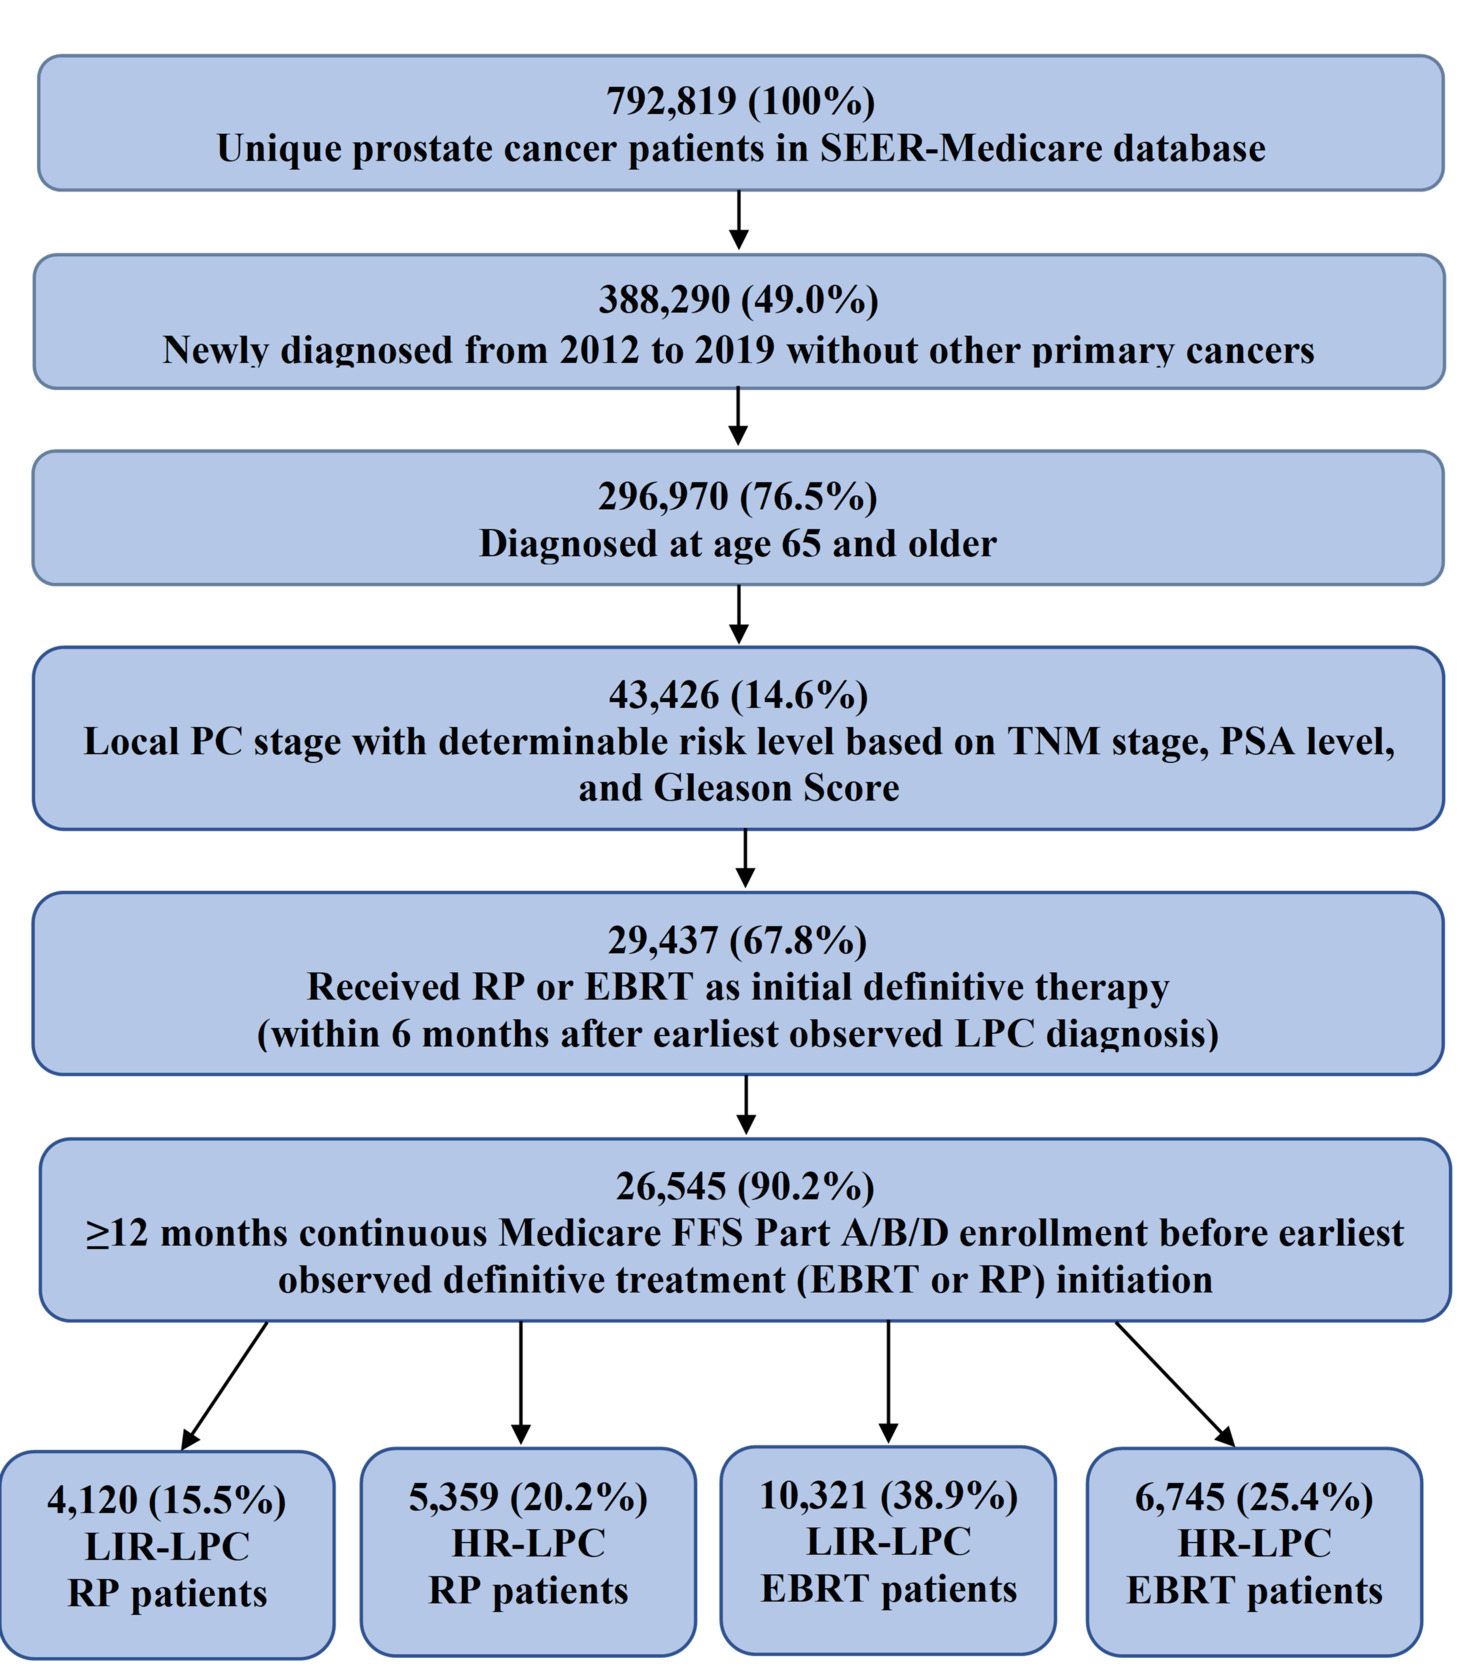
Among the 17 066 patients treated with EBRT, 60% (N = 10 321) were low or intermediate risk and 40% (N = 6745) were high risk. The mean age on index date was approximately 73 years. The majority (>83%) of patients were White. The mean NCI comorbidity score was 1.5 and 1.8, respectively, for the LIR-LPC and HR-LPC cohorts. Among the 9479 patients treated with RP, 43% (N = 4120) had LIR-LPC and 57% (N = 5359) had HR-LPC. The mean age on index date was approximately 70 years. Most (>87%) of the patients were White. Compared with the corresponding EBRT cohorts, patients in the RP cohorts appeared to have less comorbidity burden, with mean NCI comorbidity scores of 1.1 and 1.3, respectively, for the LIR-LPC and HR-LPC patients. Across cohorts, the most common comorbidities were hypertension and diabetes, followed by chronic pulmonary disease, peripheral vascular disease, and obesity. Among patients treated with EBRT, 28.3% of LIR-LPC patients and 71.6% of HR-LPC patients received ADT prior to the index date, while among patients treated with RP, 1.7% of LIR-LPC and 5.2% of HR-LPC patients received ADT.
After EBRT initiation, LIR-LPC patients had a mean follow-up time of 46 months while HR-LPC patients had a mean follow-up time of 41 months. After RP initiation, the mean follow-up time was 48 months for LIR-LPC patients and 44 months for HR-LPC patients, respectively.
All-Cause Healthcare Costs
All-cause healthcare costs across cohorts during the follow-up period are summarized in Table 2.
Among patients treated with EBRT, the mean all-cause healthcare cost in the HR-LPC cohort was $9837 higher than that in the LIR-LPC cohort ($34 441 vs $24 604 PPPY; P < .0001). Similarly, among patients treated with RP, the mean all-cause PPPY healthcare cost was $6829 higher in the HR-LPC cohort than in the LIR-LPC cohort (mean, $23 820 vs $16 991 PPPY; P < .0001). Across the EBRT and RP cohorts, the largest proportion of all-cause healthcare costs was attributed to outpatient cost, followed by inpatient and prescription drug costs. Other components, including ED visits, other medical care, and prescription drug costs, were also significantly higher in HR-LPC patients.
Prostate Cancer-Related Healthcare Costs
Prostate cancer–related healthcare costs and prostate cancer treatment costs for LIR-LPC and HR-LPC patients in the EBRT and RP cohorts during the follow-up period are summarized in Table 3.
Among patients treated with EBRT, the mean prostate cancer–related healthcare cost in the HR-LPC cohort was $7826 higher than in the LIR-LPC cohort ($20 211 vs $12 385 PPPY; P < .0001), with the largest proportion of the cost attributable to outpatient cost. Prostate cancer–related outpatient cost was $4306 higher in the HR-LPC cohort compared with the LIR-LPC cohort (mean, $15 564 vs $11 258 PPPY; P < .0001). Among patients treated with RP, the mean prostate cancer–related cost was $6090 higher in the HR-LPC cohort than in the LIR-LPC cohort ($13 354 vs $7264 PPPY, P < .0001). While the mean inpatient ($3902) and outpatient ($3206) costs were comparable in the LIR-LPC cohort, outpatient cost accounted for the largest proportion of total prostate cancer–related healthcare cost in the HR-LPC cohort ($7746) and was significantly higher than that in the LIR-LPC cohort. Across the EBRT and RP cohorts, HR-LPC patients also incurred significantly higher ED, other medical care, and prescription drug costs.
Among patients treated with EBRT, the mean prostate cancer–related drug cost was $2986 higher in the HR-LPC cohort compared with the LIR-LPC cohort ($3415 vs $429; P < .0001). Among patients treated with RP, the mean drug cost was also higher in the HR-LPC cohort, with a difference of $1953 ($2053 vs $100; P < .0001). For both treatment types, HR-LPC patients incurred significantly higher ADT, anti-androgens, other systemic therapy, bone treatment costs. The advanced PC treatment costs were also significantly higher in HR-LPC patients for both treatment types ($2114 vs $197 in EBRT; $1574 vs $67 in RP; P < .0001).
DISCUSSION
In this real-world study, we analyzed all-cause and prostate cancer–related healthcare costs for Medicare beneficiaries diagnosed with LPC, treated with EBRT or RP from 2012 to 2019. The analyses found that HR-LPC patients incurred significantly higher all-cause and prostate cancer–related healthcare costs than LIR-LPC patients, regardless of whether they received EBRT or RP as the initial definitive therapy. This observation is consistent with findings from limited prior research on the economic impact of LPC, which indicate that high-risk disease is associated with significantly increased healthcare costs.8 Gustavsen et al estimated average 10-year direct medical costs associated with the management of LPC to be $45 957, $99 445, and $188 928 for low, intermediate, and high-risk patients, respectively.8 The study also reported that HR-LPC patients incurred significantly higher cumulative cost per patient.8
The increased healthcare costs for HR-LPC patients can be attributed to several factors. First, HR-LPC patients in this analysis were older at the index date and had more comorbidities, potentially leading to higher healthcare utilization and costs. Second, treating HR-LPC is more complex than that of LIR-LPC and often requires more intensive and multimodality treatment, longer therapy durations, and more frequent monitoring.20–22 This also adds to the significant healthcare costs.23 In addition, our previous study investigating clinical outcomes in LPC patients receiving EBRT as initial therapy found that HR-LPC patients had significantly worse clinical outcomes than LIR-LPC patients, including lower 5-year metastasis-free survival (70.5% vs 87.3%; P < .001) and overall survival (66.5% vs 83.3%; P < .001), more frequent initiation of advanced prostate cancer treatment (49.7% vs 21.1%), and more common concurrent ADT use (97.0% vs 84.2%) for a longer mean duration (22.0 vs 12.2 months).24 These differences in clinical outcomes and treatment patterns likely contributed to the elevated costs observed in the current analysis.
As advanced-stage prostate cancer diagnoses continue to rise, findings from this study have important implications for healthcare resource planning and policy decision-making. The substantially higher costs observed among patients with HR-LPC highlight the greater economic burden of HR-LPC and may help health systems and payers anticipate future resource needs. In addition, these real-world cost estimates provide a benchmark for evaluating budget impact and economic value of emerging treatment strategies. Such information may inform reimbursement decisions, healthcare planning, and assessments of whether new interventions can reduce the long-term economic burden of prostate cancer. Future studies should assess the value of emerging therapies and include broader economic impacts, including patient out-of-pocket costs and caregiver burden.
Strengths and Limitations
This study contributes valuable evidence on the economic burden of LPC stratified by initial definitive treatment and risk classification, a topic with limited prior investigation. One of the strengths of this study is its comprehensive analysis of healthcare cost categories for LPC, which compared both all-cause and PC-related expenses between HR-LPC and LIR-LPC patients and identified cost patterns across different risk cohorts. By leveraging the SEER–Medicare database, this study also ensured a population-based sample of LPC patients, enhancing the generalizability of the findings.16
Nonetheless, there are several limitations in this study. First, this study was retrospective and had limitations inherent to administrative data, including potential coding errors that could lead to misclassification of diagnosis and clinical outcomes. Treatments paid by patient themselves or through other insurances may not be captured. Secondly, this study was conducted from the Medicare payer perspective and did not account for patients’ out-of-pocket costs or healthcare costs reimbursed outside of Medicare coverage. Furthermore, indirect costs, such as productivity loss due to absenteeism or caregiver burden were also not included. Third, our study is descriptive in nature and does not break down the impact on costs by individual clinical and social economic attributes. However, patients are rarely diagnosed and treated without accompanying comorbidities and socioeconomic factors. The primary goal of the current study is to quantify the overall cost burden among the target LPC population, reflecting the combined impact of patients’ clinical characteristics, initial treatment options, and broader socioeconomic context, rather than estimating the contribution of risk classification alone. Lastly, because the study focused on Medicare FFS population, the findings may not be generalizable to Medicare advantage or commercially insured patient populations.
CONCLUSION
Our study quantified the substantial economic burden in Medicare beneficiaries diagnosed with LPC, particularly among HR-LPC patients. HR-LPC patients were associated with significantly higher all-cause and prostate cancer–related healthcare costs than those with LIR-LPC, regardless of whether they received EBRT or RP. These elevated costs are likely to reflect the greater treatment intensity, longer therapy duration, and increased follow-up required for HR-LPC. The substantial cost differences between LIR-LPC and HR-LPC cohorts emphasize the unmet need for novel treatment strategies that can reduce disease progression and ultimately reduce the healthcare costs of LPC and the economic burden of prostate cancer care. Future research is needed to evaluate whether emerging treatment strategies that improve clinical outcomes can reduce healthcare utilization and costs among patients with HR-LPC.
Acknowledgments
The authors acknowledge the efforts of the National Cancer Institute; Information Management Services (IMS), Inc.; and the Surveillance, Epidemiology, and End Results (SEER) Program tumor registries in the creation of the SEER-Medicare database. The collection of cancer incidence data used in this study was supported by the California Department of Public Health pursuant to California Health and Safety Code Section 103885; Centers for Disease Control and Prevention’s (CDC) National Program of Cancer Registries, under cooperative agreement 1NU58DP007156; the National Cancer Institute’s Surveillance, Epidemiology and End Results Program under contract HHSN261201800032I awarded to the University of California, San Francisco, contract HHSN261201800015I awarded to the University of Southern California, and contract HHSN261201800009I awarded to the Public Health Institute. The ideas and opinions expressed herein are those of the authors and do not necessarily reflect the opinions of the State of California, Department of Public Health, the National Cancer Institute, and the Centers for Disease Control and Prevention or their Contractors and Subcontractors. Programming support was provided by Dengzhi Wang. Editorial assistance was provided by Cobbs Creek Healthcare and funded by Johnson & Johnson. This study was sponsored by Johnson & Johnson.
Disclosures
L.K. is an employee of AdventHealth Urology Denver and has received consulting fees from Johnson & Johnson. S.D. and J.H. are employees of Johnson & Johnson and stockholders of Johnson & Johnson. N.S. is an employee of Carolina Urologic Research Center and has received consulting fees from Johnson & Johnson. K.J. was an employee of Johnson & Johnson at the time the manuscript was written.
Funding
This study was supported by Johnson & Johnson.
Data Availability Statement
The datasets used to conduct this study are available upon approval of a research protocol from the National Cancer Institute. Instructions for obtaining these data are available at https://healthcaredelivery.cancer.gov/seermedicare/obtain/.