
INTRODUCTION
An estimated 1 in 8 men in the United States (US) will be diagnosed with prostate cancer (PC) during their lifetime, and over 300 000 cases were expected to be newly diagnosed in 2025.1,2 Advances in PC detection, including the widespread use of prostate-specific antigen (PSA) testing and the integration of multiparametric magnetic resonance imaging into diagnostic pathways, have increased early diagnosis, and nearly 70% of cases are now identified at the localized stage.3,4
Localized PC (LPC) refers to disease confined to the prostate that has not spread to regional lymph nodes or distant sites, and is stratified into low-, intermediate-, high-, or very high–risk categories based on tumor node metastasis (TNM) staging, PSA levels, and Gleason score, per the NCCN Clinical Practice Guidelines in Oncology (NCCN Guidelines®).5 Management is guided primarily by risk group but should additionally incorporate shared decision-making that considers comorbidities, life expectancy, and patient preferences.6,7 Both the NCCN Guidelines and the American Urological Association (AUA) recommend active surveillance as the preferred approach for most patients with low-risk LPC.5,7 Radical prostatectomy or radiation therapy (RT) may be appropriate for select low-risk LPC cases including those with high-volume cancer or higher PSA density.5,7 For patients with intermediate- or high-risk LPC, treatment typically involves radical prostatectomy or RT, with or without brachytherapy or androgen-deprivation therapy (ADT).5,7 RT most often consists of external beam RT (EBRT), delivered using techniques such as 3-dimensional conformal RT, intensity modulated RT, or stereotactic body RT.8 As both radical prostatectomy and EBRT are well-established and effective treatment options, selection is often driven by patient preference regarding treatment logistics and potential toxicity.9
Despite the widespread use of EBRT for LPC, there is limited existing literature describing clinical and economic outcomes stratified by risk group. Among the few studies that have examined this topic, high-risk vs low/intermediate-risk LPC was associated with a higher risk of advanced PC therapy use, metastasis, and death,10,11 as well as higher medical costs.12 Accordingly, the present real-world study aimed to comprehensively evaluate clinical and economic outcomes among patients with high-risk vs low/intermediate-risk LPC treated with EBRT in US clinical practice.
METHODS
Data Source
Linked patient-level data spanning January 1, 2016, to August 31, 2024, were obtained from 2 unique data sources: a clinical electronic medical record (EMR) database (Precision Point Specialty Analytics; PPS) and an administrative claims database (Komodo Research Database; KRD+).
PPS contains a wide range of demographic and clinical data collected as part of routine urology practice in the US, including PSA results, dispensation information, and PC-specific medication and procedure data not available from traditional administrative databases. In contrast, KRD+ is an insurance claims database comprising open and closed claims for >320 million US patients across commercial, Medicaid, and Medicare insurers. It includes information on insurance eligibility, diagnoses and procedures received in inpatient and outpatient settings, and prescription fills. Notably, mortality data captured in KRD+ are obtained from multiple third-party sources that aggregate information from national and state governments, public listings, private claims, and obituaries and are therefore not dependent on data from healthcare providers.
Linkage of patient-level PPS and KRD+ data was performed by Datavant using their patent-pending, machine learning–validated, de-identification technology in which private patient information is replaced with an encrypted token that cannot be reverse-engineered to reveal the original information.
This study was considered exempt research under 45 CFR § 46.104(d)(4) as it involved only the secondary use of data that were de-identified in compliance with the Health Insurance Portability and Accountability Act (HIPAA), specifically, 45 CFR § 164.514.
Study Design
This study used a retrospective, longitudinal design to analyze clinical and cost outcomes among high-risk and low/intermediate-risk cohorts of patients with LPC who received EBRT (Supplementary Figure S1).
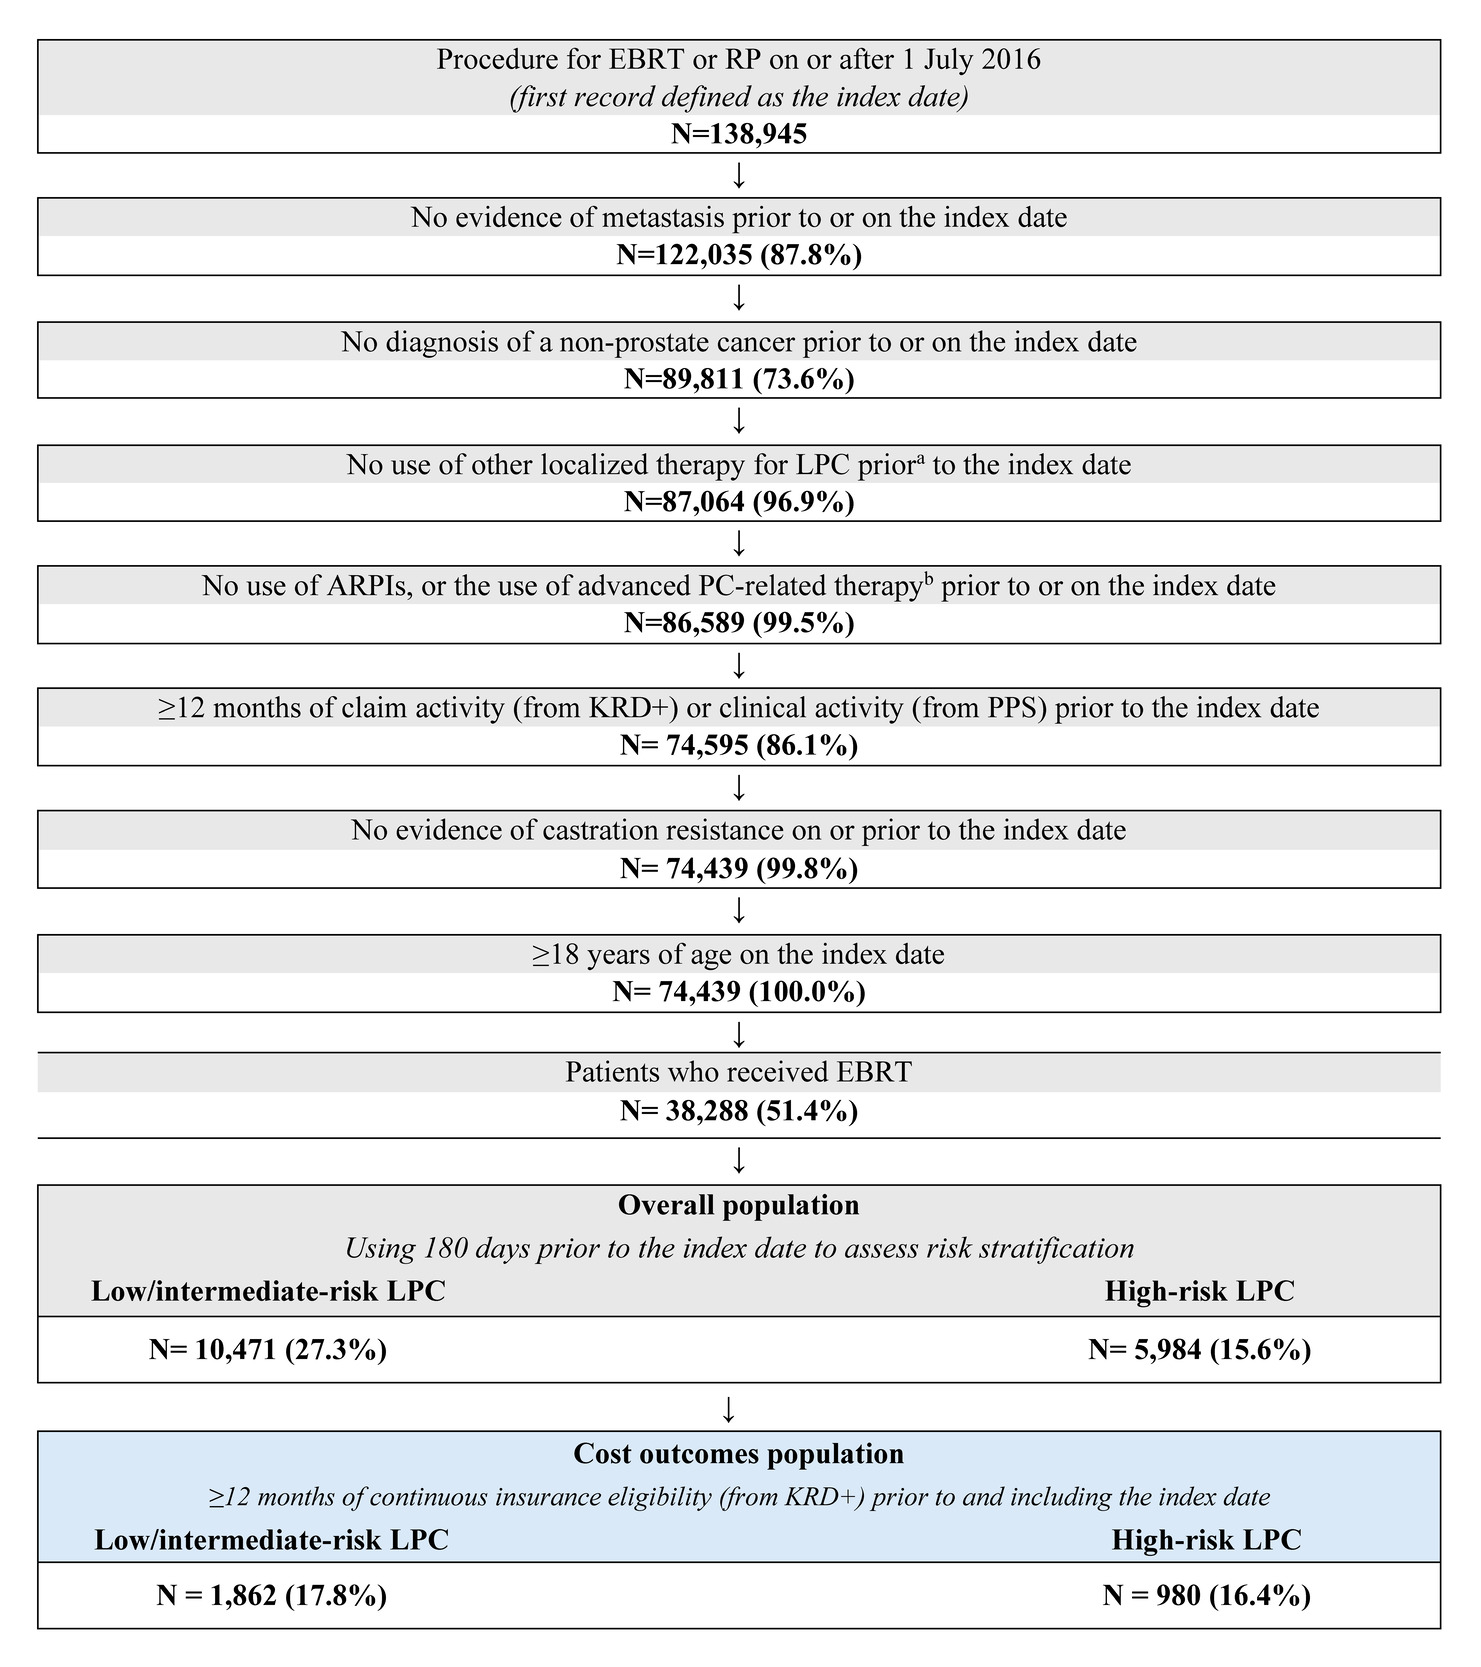
Adult male patients were required to have initiated EBRT on or after July 1, 2016, with the index date defined as the date of the first record for EBRT. To restrict the study population to patients with LPC treated with EBRT, patients were excluded based on having any of the following clinical indicators prior to or on the index date: (1) evidence of metastasis, to restrict the study population to patients with localized disease; (2) diagnosis of non-prostate cancer, to restrict the study population to patients with PC; (3) use of other localized therapy for LPC (ie, cryotherapy, interstitial prostate brachytherapy, high-intensity focused ultrasound), to restrict the study population to patients treated with EBRT; (4) use of advanced PC-related therapy (ie, androgen receptor pathway inhibitors [ARPIs], chemotherapy, immunotherapy, estrogens, radiopharmaceuticals, poly [ADP-ribose] polymerase [PARP] inhibitors), as these therapies are indicated for advanced or metastatic disease; or (5) evidence of castration resistance, as this reflects progression beyond localized, hormone-sensitive disease. Patients were also required to have ≥12 months of insurance claim activity in KRD+ or clinical activity in PPS pre-index. In the overall population meeting all criteria above, a subgroup of patients with ≥12 months of continuous insurance eligibility in KRD+ prior to and including the index date were identified for the assessment of economic outcomes.
Patients were classified into mutually exclusive high-risk and low/intermediate-risk cohorts based on their LPC risk level (Supplementary Table S1). Risk was determined according to TNM staging, PSA level, and Gleason score during the 180 days pre-index, in alignment with the NCCN Guidelines.5 However, not all patients had records for all 3 clinical variables, and thus risk classification was performed using the minimum available data (eg, patients with a PSA level of >20 ng/mL were classified as high-risk regardless of whether other tests were available). The proportion of patients with an LPC risk assessment determined by 1, 2, or all 3 clinical variables is reported in Supplementary Table S2.
The baseline period included 12 months prior to the index date. Clinical outcomes were assessed during an observation period spanning from the index date until the latter of end of claim activity in KRD+ or clinical activity in PPS (including death), both no later than the end of data availability (ie, August 31, 2024). Cost outcomes were assessed during an observation period spanning from the index date until the earliest of end of continuous insurance eligibility or end of data availability. The LPC period was defined as the time from the index date until the earliest evidence of disease progression, defined as metastasis, castration-resistance, or biochemical recurrence (BCR). BCR was defined as an increase of ≥2 ng/mL from the nadir PSA value observed after treatment and was evaluated from the index date until the earliest of metastasis, initiation of advanced PC-related therapy (ie, ARPIs, chemotherapy, immunotherapy, radiopharmaceuticals, PARP inhibitors, estrogen), castration resistance, or end of clinical activity in PPS.13 The date of the increase defined the BCR date. The nadir PSA value was time-updated, meaning it changed in time to the lowest PSA measurement captured during the observation period. The index EBRT-treatment period was defined as the first 90 days of the observation period starting on the index date (inclusively).
Study Outcomes
Demographic (ie, age, race, geographic region, payer type) and clinical characteristics (ie, time between PC diagnosis and index date, ADT use overlapping the index date, prior first-generation ARPI use, prior bone antiresorptive therapy, Quan-Charlson Comorbidity Index [Quan-CCI], comorbidities, digital rectal examination, most recent PSA result, most recent TNM staging information, testosterone testing, earliest Gleason score, conventional and next-generation imaging tests) were evaluated prior to or on the index date.
Metastasis-free survival (MFS) and event-free survival (EFS) were evaluated among the overall patient population. MFS was defined as the time from the index date to the earliest date of metastasis or death from any cause, while EFS was defined as the time from the index date to the earliest date of BCR, metastasis, or death from any cause.
Total all-cause and PC-related healthcare costs were evaluated among the subgroup of patients with continuous insurance eligibility and reported per-patient-per-year (PPPY). PC-related costs were identified based on International Classification of Diseases, 10th Revision, Clinical Modification (ICD-10-CM) code C61 and procedure codes for luteinizing hormone-releasing hormone or other therapies for PC recommended by the NCCN Guidelines.5
Costs were reported in 2024 US dollars (USD) by adjusting for inflation using the medical care component of the US Consumer Price Index, and reported as imputed allowed amounts, reflecting the total payer and patient costs from the KRD+. Components of total healthcare costs were reported based on service type and included pharmacy and medical (ie, inpatient, outpatient, emergency room, and other services) costs. All cost variables were truncated at the 99th percentile to account for the influence of extreme outliers.
Costs were reported during the baseline, observation, and LPC periods, separately. Additionally, index treatment costs, including index procedure costs (ie, claims with a procedure code for EBRT) and index procedure-related costs (ie, claims with a procedure code for medical acts directly related to EBRT), were reported during the index treatment period.
Statistical Analysis
Baseline variables were balanced between the high-risk and low/intermediate-risk cohorts using inverse probability of treatment weighting (IPTW). Propensity scores (PS) were generated using probability estimates from a logistic regression model based on dependent (ie, high-risk) and independent (ie, age, race, geographic region, payer type, year of index date, time between PC diagnosis and index date, use of first-generation ARPI, use of bone antiresorptive therapy, and baseline Quan-CCI) variables. Patients in the high-risk and low/intermediate-risk cohorts were attributed a weight of 1/PS and 1/(1-PS), respectively, with weights normalized using the mean weight of each respective cohort and truncated to the 95th percentile.14 No patients were removed from the study due to use of IPTW. The weighted cohorts were considered well-balanced if individual baseline characteristics had a standardized difference of <10%.15 Two separate PS models and set of weights were generated for the overall population (ie, comparison of clinical outcomes) and the subgroup of patients with continuous insurance eligibility (ie, comparison of cost outcomes).
Continuous variables were reported using means, standard deviations (SDs), and medians, and categorical variables were reported using frequencies and proportions. Among the clinical outcome population, weighted Kaplan-Meier (KM) analyses were used to assess MFS and EFS, separately, for the high-risk and low/intermediate-risk cohorts. A weighted Cox proportional hazards model was used to calculate hazard ratios (HRs) and 95% confidence intervals (CIs) comparing MFS and EFS between the high-risk and low/intermediate-risk cohorts. Results were reported at 36- and 60-months post-index.
Among the subgroup of patients with continuous insurance eligibility, total all-cause and PC-related healthcare costs during the observation period were compared between the high-risk and low/intermediate-risk cohorts using mean cost differences, estimated based on weighted ordinary least squares regression. To account for skewness in the distribution of cost outcomes, the 95% CIs and P values for mean cost differences were estimated using nonparametric bootstrapping procedures with 500 replications.
SAS Enterprise Guide software Version 7.15 (SAS Institute) was used to perform all analyses.
RESULTS
Patient Characteristics
Overall population: Among patients with LPC treated with EBRT, 5984 were included in the high-risk cohort and 10 471 were included in the low/intermediate-risk cohort (Figure 1). Baseline characteristics were largely well-balanced after weighting (ie, standardized difference <10%). The mean (median) age was 70.8 (71.0) years in the high-risk cohort and 70.5 (71.0) years in the low/intermediate-risk cohort. Among the high-risk and low/intermediate-risk cohorts, 49.5% and 49.7% of patients, respectively, were White and 17.1% and 16.8% of patients, respectively, were Black or African American (Table 1; Supplementary Table S3). Most patients in each cohort were insured with Medicare (high-risk: 76.7%; low/intermediate-risk: 76.0%). The mean (median) Quan-CCI was similar in both cohorts (high-risk: 3.3 [3.0]; low/intermediate-risk: 3.2 [3.0]).
Cost Outcomes Population
A subset of 980 patients in the high-risk cohort and 1862 patients in the low/intermediate-risk cohort were selected for the evaluation of cost outcomes. After weighting, baseline characteristics were largely well-balanced between cohorts (ie, standardized difference <10%). The mean (median) age was 68.9 (69.0) years and 68.6 (69.0) years in the high-risk and low/intermediate-risk cohorts, respectively. In the high-risk cohort, 45.1% of patients were White and 19.2% of patients were Black or African American, while in the low/intermediate-risk cohort, 45.8% of patients were White and 18.2% of patients were Black or African American. The mean (median) Quan-CCI was 3.6 (3.0) and 3.5 (3.0) in the high-risk and low/intermediate-risk cohorts, respectively. The mean (median) number of days patients received EBRT during the observation period was 37.6 (41.0) days in the high-risk cohort and 35.3 (40.0) days in the low/intermediate-risk cohort.
The mean age of patients in the cost outcomes population was numerically similar to that in the overall population, as were the proportions of patients who were White and Black or African American, respectively. While Medicare was the most common payer type in both the overall and cost outcomes populations, a numerically higher proportion of patients in the cost outcomes population were insured commercially.
During the baseline period mean (median) total all-cause healthcare costs were $14 557 ($11 416) PPPY in the high-risk cohort and $13 017 ($10 030) PPPY in the low/intermediate-risk cohort, including mean (median) all-cause pharmacy costs of $693 ($41) PPPY and $757 ($41) PPPY, respectively, and mean (median) all-cause medical costs of $13 801 ($10 819) PPPY and $12 100 ($9319) PPPY, respectively (Supplementary Table S4). Mean (median) total PC-related healthcare costs were $8579 ($6818) PPPY in the high-risk cohort and $7268 ($5666) PPPY in the low/intermediate-risk cohort.
Clinical Outcomes
Within the overall population (high-risk: N = 5984; low/intermediate-risk: N = 10 471), the mean (median) duration of the observation period was 46.3 (43.8) months among the high-risk cohort and 47.8 (45.9) months among the low/intermediate-risk cohort. The mean (median) number of days receiving EBRT was 37.7 (44.0) days and 36.0 (41.0) days for patients in the high-risk or low/intermediate-risk cohort, respectively.
Metastasis-free Survival
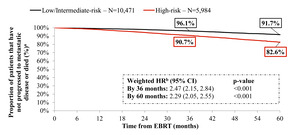
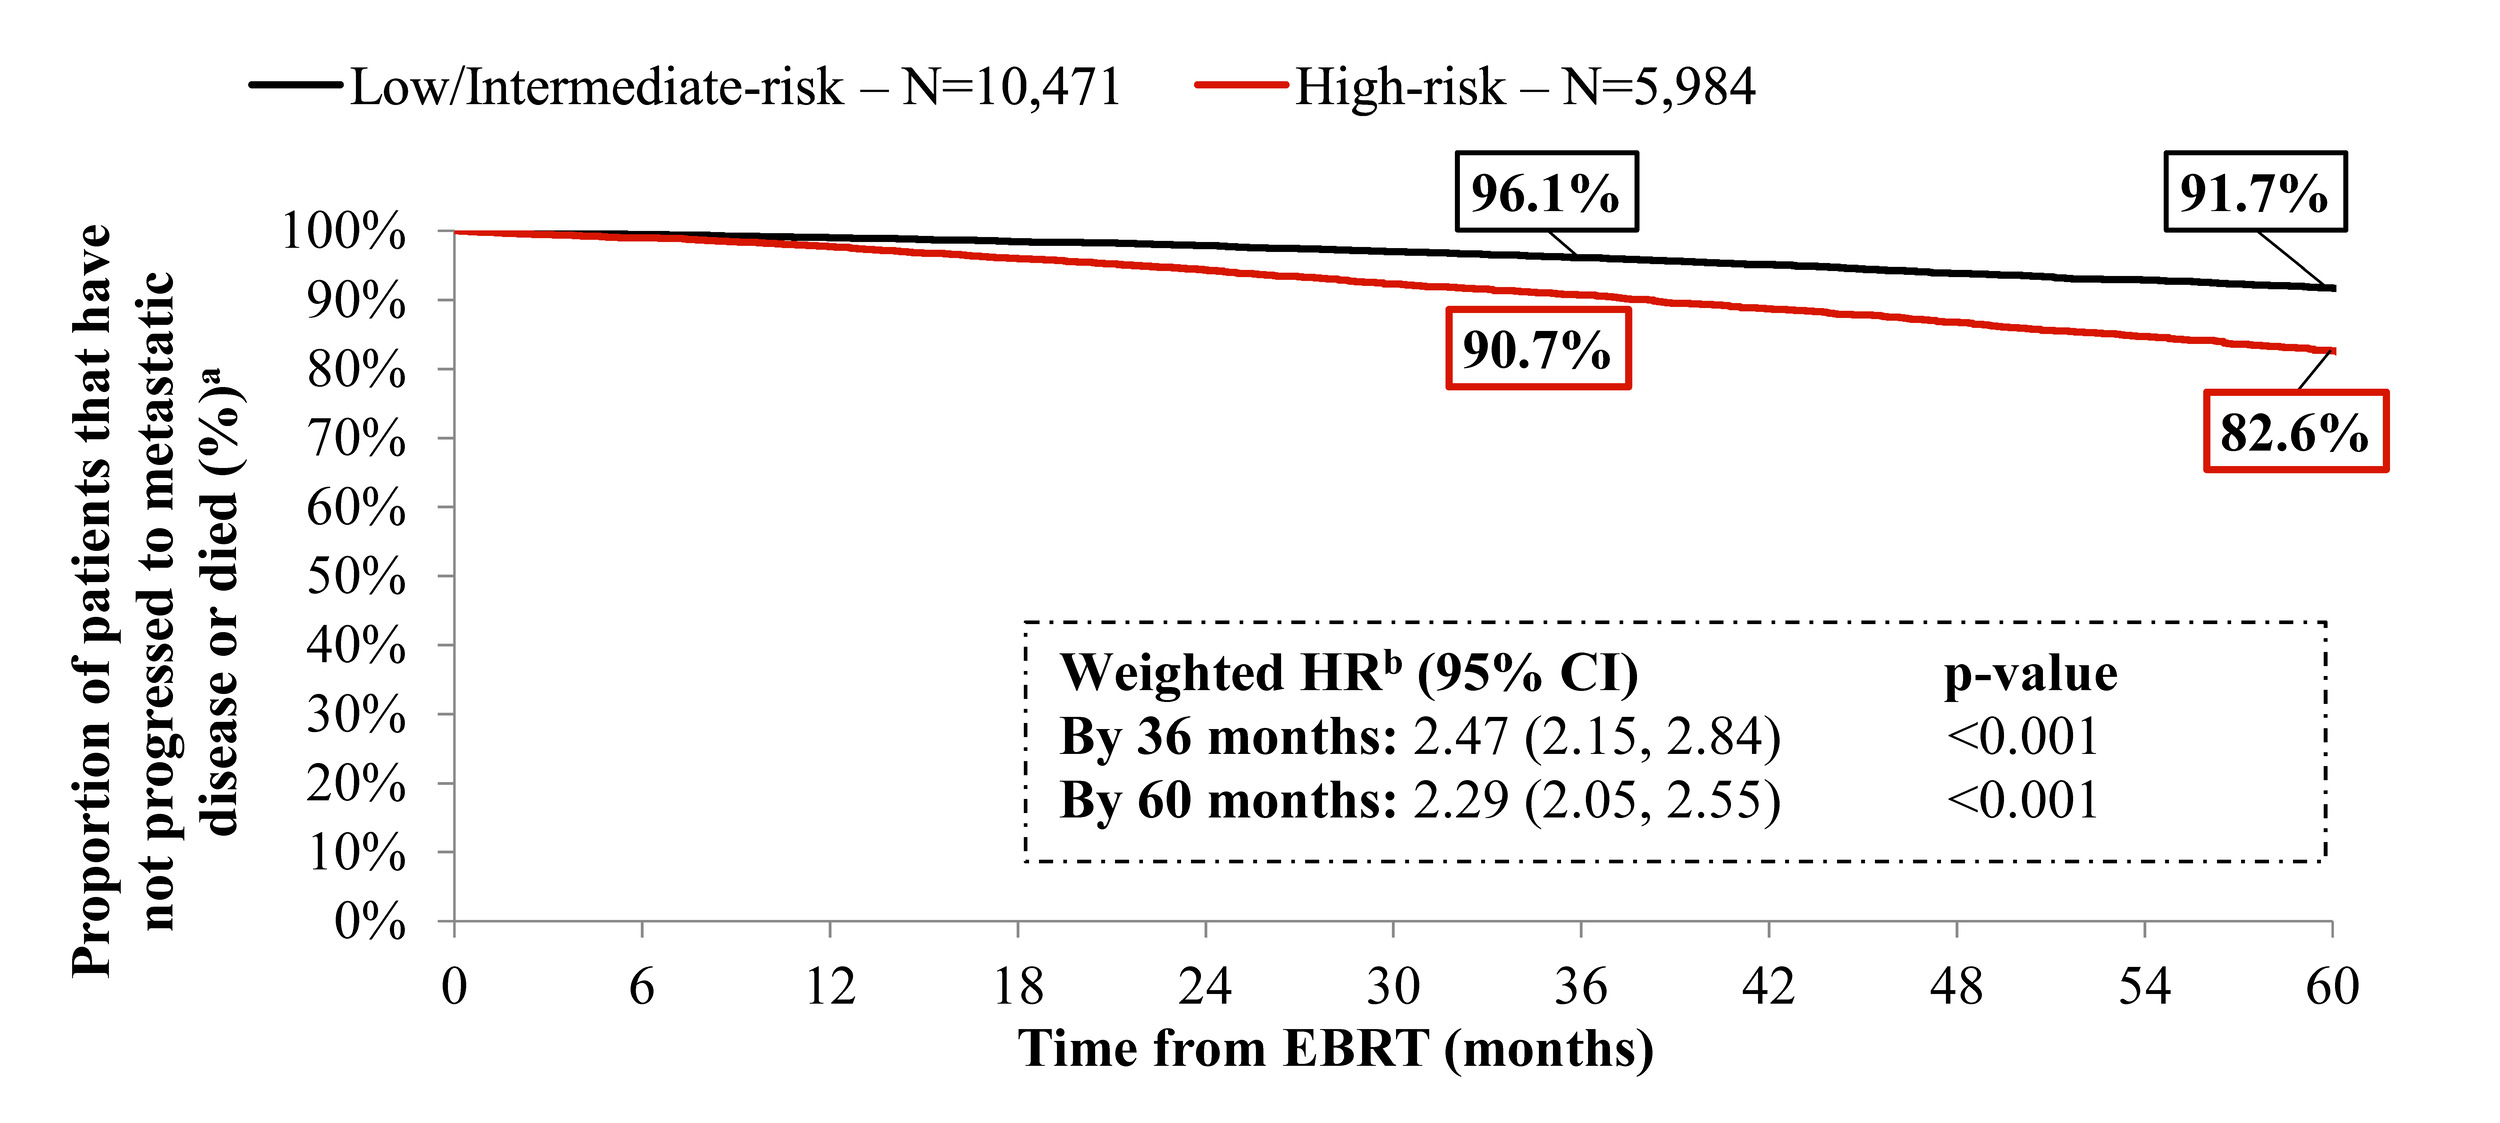
A higher proportion of patients in the high-risk cohort had progressed to metastasis or death, relative to patients in the low/intermediate-risk cohort by both 36 months (MFS rate: high-risk, 90.7%; low/intermediate-risk, 96.1%) and 60 months (high-risk, 82.6%; low/intermediate-risk, 91.7%) post-index. Compared with patients with low/intermediate-risk, patients with high-risk were 2.47 times more likely to develop metastasis or die by 36 months (HR [95% CI]: 2.47 [2.15, 2.84]; P < .001) and 2.29 times more likely by 60 months (HR [95% CI]: 2.29 [2.05, 2.55]; P < .001) (Figure 2). Results remained robust when analyzed among patients with ≥2 available risk classification components (Supplementary Figure S2A).
Event-free Survival
Similarly, a higher proportion of patients in the high-risk cohort had progressed to metastasis, BCR, or death relative to patients in the low/intermediate-risk cohort by both 36 months (EFS rate: high-risk, 88.0%; low/intermediate-risk, 93.3%) and 60 months (high-risk, 78.4%; low/intermediate-risk, 88.1%) post-index. Compared with patients with low/intermediate-risk LPC, patients with high-risk LPC were 1.84 times more likely to have BCR, metastasis, or death by 36 months (HR [95% CI]: 1.84 [1.65, 2.06]; P < .001) and 1.90 times more likely at 60 months (HR [95% CI]: 1.90 [1.73, 2.08]; P < .001) post-index (Supplementary Figure S3). Results remained robust when analyzed among patients with ≥2 available risk classification components (Supplementary Figure S2B).
Cost Outcomes
Observation period: within the cost outcomes population (high-risk: N = 980; low/intermediate-risk: N = 1862), the mean (median) observation period duration was 31.8 (28.1) months in the high-risk cohort and 32.7 (27.2) months in the low/intermediate-risk cohort.
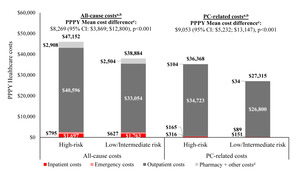
Weighted mean [median] total all-cause healthcare costs were significantly higher in the high-risk cohort ($47 152 [$29 517] PPPY) vs the low/intermediate-risk cohort ($38 884 [$24 317] PPPY), representing a cost difference (95% CI) of $8269 (3869, 12 800) PPPY (P < .001; Figure 3). Patients in the high-risk vs low/intermediate-risk cohort incurred higher weighted mean all-cause pharmacy costs ($2274 vs $1941 PPPY; cost difference [95% CI]: $333 [−94 , 731] PPPY; P = .092) and significantly higher weighted mean [median] all-cause medical costs ($44 541 [$27 510] vs $36 690 [$22 355] PPPY; cost difference [95% CI]: $7850 [3558, 12 173] PPPY; P < .001). The observed difference in weighted mean total healthcare costs was primarily driven by significantly higher outpatient costs in the high-risk vs low/intermediate-risk cohort ($40 596 [$24 436] vs $33 054 [$19 707] PPPY; cost difference [95% CI]: $7543 [3409, 11 683]; P < .001).
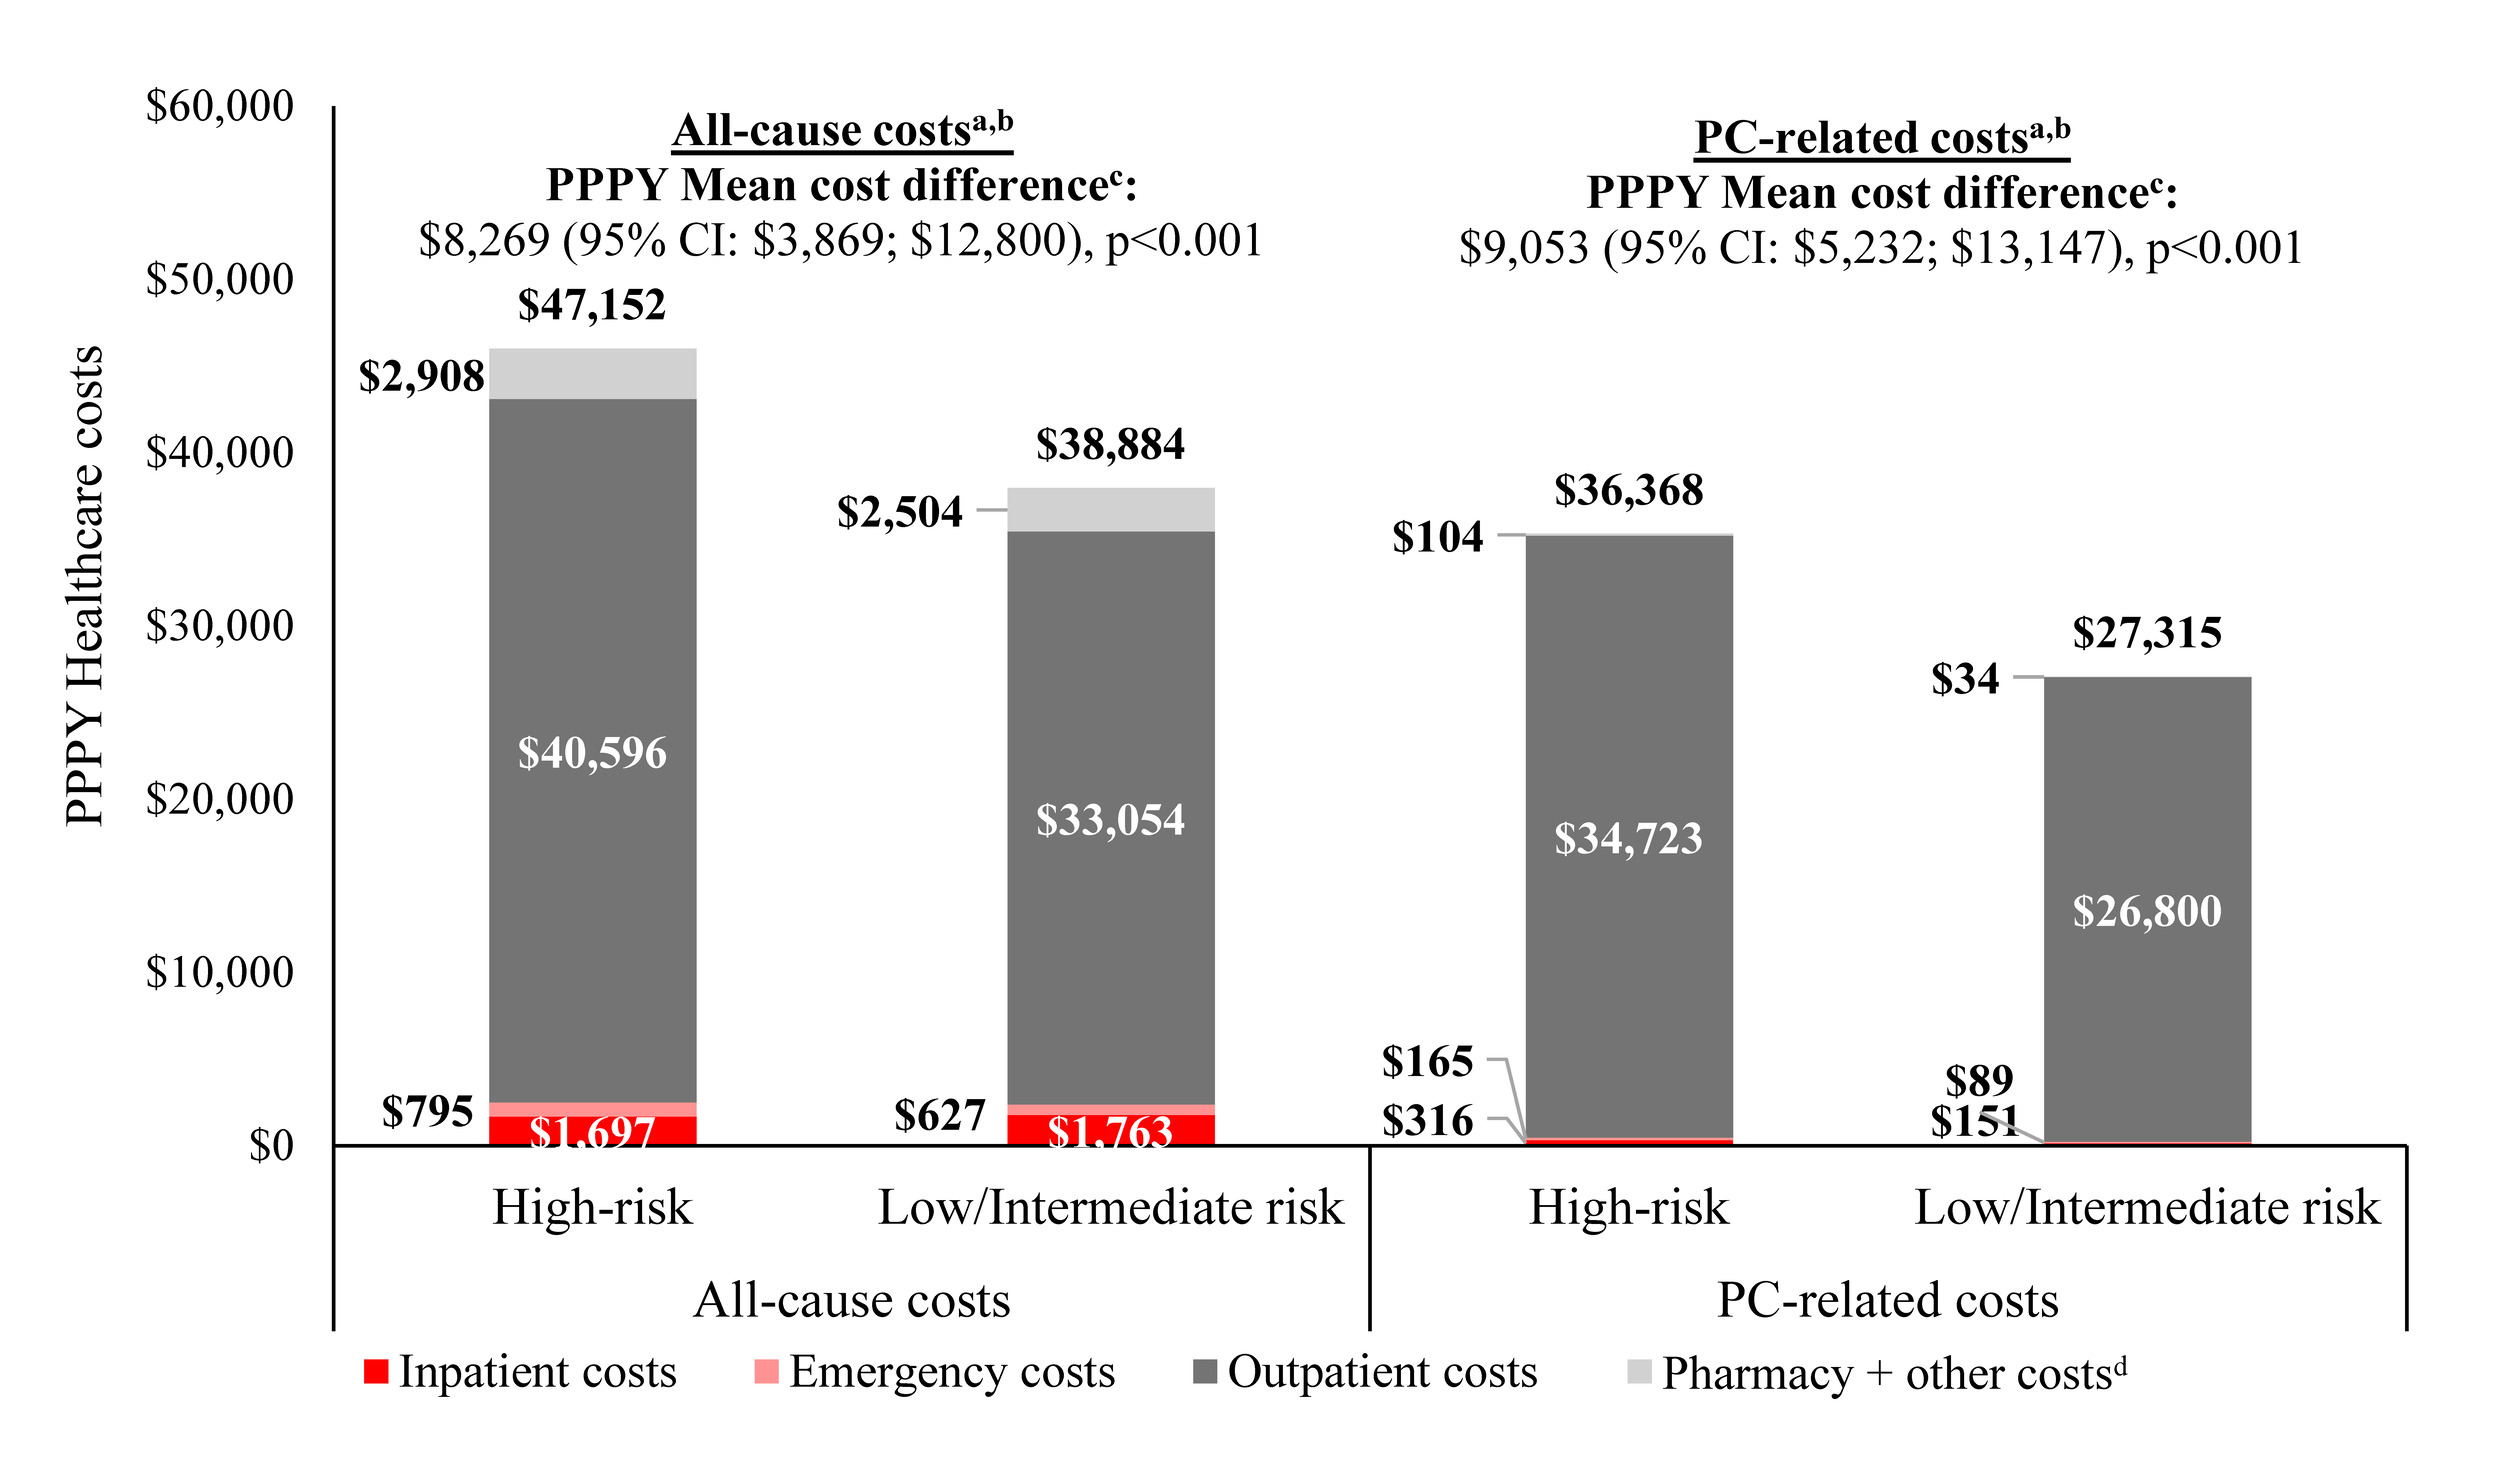
PC-related costs were significantly higher in the high-risk vs low/intermediate-risk cohort, including weighted mean [median] total PC-related healthcare costs ($36 368 [$19 456] vs $27 315 [$14 303] PPPY; cost difference [95% CI]: $9053 (5232, 13 147) PPPY; P < .001), weighted mean [median] PC-related pharmacy costs ($89 [$0] vs $26 [$0] PPPY; cost difference [95% CI]: $62 [24, 106] PPPY; P < .001), and weighted mean [median] PC-related medical costs ($35 718 [$18 815] vs $27 233 [$14 276] PPPY; cost difference [95% CI]: $8486 [4569, 12 381] PPPY; P < .001).
LPC Period
The mean (median) duration of the LPC period was 30.0 (25.2) months in the high-risk cohort and 31.7 (26.0) months in the low/intermediate-risk cohort.
Weighted mean (median) total all-cause healthcare costs were $46 793 ($29 504) PPPY for patients in the high-risk cohort and $39 210 ($24 810) PPPY for patients in the low/intermediate-risk cohort (Supplementary Figure S4). Weighted mean (median) all-cause pharmacy costs were $2018 ($221) PPPY and $1877 ($229) PPPY in the high-risk and low/intermediate-risk cohorts, respectively, while weighted mean (median) all-cause medical costs were $44 691 ($27 374) PPPY and $37 034 ($22 733) PPPY, respectively.
Patients in the high-risk and low/intermediate-risk cohorts incurred $36 251 ($19 301) PPPY and $27 727 ($14 661) PPPY in weighted mean (median) total PC-related healthcare costs, with weighted mean (median) PC-related medical costs of $36 031 ($18 958) PPPY and $27 644 ($14 618) PPPY, respectively, accounting for >99% of total PC-related healthcare costs during the LPC period.
Index EBRT Period
Weighted mean (median) total all-cause healthcare costs were $38 648 ($33 039) PPPY and $34 989 ($29 772) PPPY in the high-risk and low/intermediate-risk cohorts, respectively, with weighted mean (median) all-cause medical costs of $38 185 ($32 643) PPPY and $34 568 ($29 108) PPPY, respectively, accounting for >99% of total all-cause healthcare costs. Weighted mean (median) total PC-related healthcare costs were $36 821 ($31 335) PPPY in the high-risk cohort and $33 171 ($28 118) PPPY in the low/intermediate-risk cohort.
DISCUSSION
Using linked EMR and administrative claims data, this real-world study evaluated clinical outcomes and healthcare costs among patients with high-risk vs low/intermediate-risk LPC treated with EBRT in real-world US clinical practice. Compared with patients with low/intermediate-risk LPC, those with high-risk LPC experienced a significantly higher risk of disease progression, metastasis, BCR, or death by both 36 and 60 months following EBRT initiation. Additionally, all-cause and PC-related healthcare costs were significantly higher in the high-risk cohort compared with the low/intermediate-risk cohort following EBRT initiation. Together, these findings reflect the inherently poorer prognosis and greater economic burden associated with high-risk LPC and suggest an unmet need for more effective treatment strategies in this patient population.
To our knowledge, only one study has previously evaluated real-world clinical outcomes following EBRT among patients with LPC, stratified by risk group.10 In that study, Surveillance, Epidemiology, and End Results (SEER)−Medicare data were analyzed for patients aged ≥65 years with newly diagnosed LPC or locally advanced PC who received EBRT as initial therapy.10 Patients were classified as either low/intermediate-risk (including very low-, low-, and intermediate-risk groups) or high-risk (including high- and very high-risk groups). Over a mean follow-up of more than 3.5 years, patients with high-risk LPC had nearly twice the risk of metastasis or death compared with those with low/intermediate-risk LPC (HR [95% CI]: 1.97 [1.78, 2.17]; P < .0001). These findings are consistent with those of the present study, whereby patients with high-risk vs low/intermediate-risk LPC had an approximately 2.5 times greater risk of metastasis or death at 3 years following EBRT initiation (HR [95% CI]: 2.47 [2.15, 2.84]; P < .001). In a separate real-world analysis of EMR data from the Veterans Health Administration, clinical outcomes were reported for more than 40 000 patients with LPC treated with definitive RT.11 Patients were stratified into low-, intermediate-, and high-risk groups, and 10-year outcomes, including overall survival, PC-specific survival, and MFS, worsened progressively with increasing risk status (all P < .001). Together, these findings highlight the link between high-risk status at LPC diagnosis and poorer clinical outcomes following EBRT in LPC. The current study underscores the value of using urology EMR data linked with administrative claims to provide a more complete patient profile for LPC risk classification and outcome assessment.
The present study provides novel insight into the healthcare costs associated with LPC treatment, revealing considerable all-cause and PC-related costs following EBRT. Specifically, patients with high-risk LPC incurred $8269 PPPY higher total all-cause healthcare costs compared with those with low/intermediate-risk LPC, driven primarily by higher outpatient costs in the high-risk cohort (P < .001). Direct medical costs associated with LPC management, stratified by patient risk status, have previously been estimated from the US commercial payer perspective using a decision-analytic model.12 In patients with LPC treated with definitive RT, cumulative per-patient costs were descriptively higher among those with high-risk vs low- or intermediate-risk LPC at both 5 years (low-risk: $51 914; intermediate-risk: $63 806; high-risk: $107 017) and 10 years (low-risk: $75 647; intermediate-risk: $130 466; high-risk: $213 882) following RT initiation. Though this study provides evidence linking higher healthcare costs with greater risk status in patients with LPC, future research among those treated with EBRT is warranted to corroborate and expand on the current findings.
Despite the considerable clinical and economic burden demonstrated among patients with high-risk LPC, progression to metastatic disease is associated with an even greater impact on both clinical outcomes and healthcare costs. High-risk patients with LPC are more likely to progress to metastatic disease, which is associated with significantly higher medical costs and healthcare resource use over 12 months compared with patients who do not progress.16,17 A prior study using linked SEER-Medicare data estimated that progression from localized stage to metastatic PC was associated with more than a $50 000 increase in annual healthcare costs during the first 12 months following metastasis.18 In another study that used administrative claims data, Trinh et al identified progression from localized to metastatic PC to be associated with a 3-fold increase in total direct all-cause healthcare costs over a mean follow-up period of 15 months.19 Furthermore, upon progression to metastatic PC, the 5-year survival rate was estimated to be 37.9%.4 Therefore, early monitoring in combination with more effective treatments is needed to reduce the burden among patients with LPC while preventing progression to metastatic PC.
The treatment landscape for LPC continues to evolve, with recent and ongoing clinical trials evaluating the effectiveness of both novel and existing agents for LPC management.20–23 Future real-world studies should aim to assess both the clinical and economic burden associated with these treatments in US clinical practice.
Limitations
This study is associated with several limitations inherent to the use of real-world data. First, this study relied on EMR and administrative claims data, which may contain inaccuracies or omissions. The PPS component of the linked dataset did not include diagnoses, medical services, or prescriptions filled outside the PPS urology practice network. Although linkage with KRD+ allowed for the capture of relevant care received outside of the PPS network, including radiation oncology, imaging, and hospitalizations, some services may still not have been captured. Second, residual confounding following IPTW may have been present because of potential confounders not measured or not available in the data. Further, selection bias cannot be ruled out, as the choice to pursue EBRT rather than an alternative treatment may reflect unmeasured factors, such as patient preference or physician judgment. Third, given open-source insurance claims and EMR data were used in this study, patients’ complete medical histories, including diagnoses, procedures, or medication records, may not be complete as continuous insurance eligibility was not required for the overall study population. However, given most of LPC-related care is received in the urology practice setting, the key procedures, treatments, and outcomes would be captured. Fourth, the follow-up duration in this study is relatively short compared with the natural history of LPC. As such, the present results may understate both clinical event rates and cumulative cost differences between cohorts. Future studies with long-term follow-up are warranted to fully characterize outcomes and costs in this population. Fifth, risk classification relied on partial data when TNM stage, PSA level, and Gleason score were not all recorded within the 180 days pre-index. It should also be noted that observed differences reflect associations between LPC risk status and outcomes among patients treated with EBRT in routine clinical practice rather than causal effects of EBRT.
CONCLUSION
In this real-world study, patients with high-risk LPC demonstrated significantly worse MFS and EFS following EBRT compared with those with low/intermediate-risk LPC, with a higher risk of disease progression, recurrence, or death. Additionally, patients with high-risk vs low/intermediate-risk LPC incurred greater healthcare costs following EBRT, driven primarily by outpatient costs. These findings reflect the substantial clinical and economic burden associated with high-risk LPC and underscore an unmet need for more effective treatment options among this patient population.
Acknowledgments
Medical writing assistance was provided by professional medical writer Molly Gingrich, MSc, an employee of Analysis Group, Inc., a consulting company that has provided paid consulting services to Johnson & Johnson, which funded the development and conduct of this study and manuscript.
Disclosures
N.S. is an employee of the Carolina Urologic Research Center and has received consulting fees from Johnson & Johnson, Bayer, Dendreon, Tolmar, Ferring, Medivation/Astellas, Amgen, Pfizer, AstraZeneca, Astellas Pharma, AbbVie, Merck, Bristol Myers Squibb/Sanofi, Exact Imaging, FerGene, InVitae, MDxHealth, Myriad Genetics, Propella Therapeutics, Genzyme, Sanofi, CG Oncology, Genesis Cancer Care, Urogen Pharma, Speciality Networks, PeerView, Clarity Pharmaceuticals, Lantheus Medical Imaging, Lilly, Photocure, Telix Pharmaceuticals, AIkido Pharma, Arquer Diagnostics, Asieris Pharmaceuticals, Minomic, Novartis, PlatformQ Health, Promaxo, Protara Therapeutics, Fize Medical, Accord Research, Antev, Aura Biosciences, Bioprotect, and Sumitomo Pharma Oncology. N.S. has received research funding from AbbVie, Amgen, Astellas Pharma, AstraZeneca, Bayer, Bristol Myers Squibb/Pfizer, Boston Scientific, Clovis Oncology, Dendreon, Exact Imaging, Ferring, Foundation Medicine, InVitae, Johnson & Johnson, MDxHealth, Merck, Myovant Sciences, Myriad Genetics, Nymox, Pfizer, Sanofi, Sesen Bio, Tolmar, CG Oncology, DisperSol, FORMA Therapeutics, Guardant Health, Jiangsu Yahong Meditech, Novartis, Pacific Edge, POINT Biopharma, Propella Therapeutics, SeaGen, MT Group, Theralase, Veru, Zenflow, Advantagene, Aragon Pharmaceuticals, Endocyte, Exelixis, FKD Therapies, Genentech, Istari Oncology, Medivation, OncoCellMDx, ORIC Pharmaceuticals, Palette Life Sciences, Plexxikon, RhoVac, Steba Biotech, Urogen Pharma, Urotronic, US Biotest, and Vaxiion for work performed outside of the current study. B.L. is an employee of Chesapeake Urology and has received consulting fees from Johnson & Johnson, Dendreon, Astellas Pharma, Bayer, AstraZeneca/MedImmune, Merck, Tolmar, AbbVie, Pfizer, and Myovant Sciences. L.K. has received consultant and speaker fees from Johnson & Johnson, Ferring, Astellas, Bayer, AstraZeneca and Pfizer and has participated in clinical trials with Johnson & Johnson, Bayer, Astellas, Ferring, Pfizer, Protara, and ImmunisAI. G.B. is an employee of New Jersey Urology and has received consulting fees from Johnson & Johnson. C.P. and S.B. are employees and stockholders of Johnson & Johnson. F.K., C.R., and D.P. are employees of Analysis Group, Inc., a consulting company that has provided paid consulting services to Johnson & Johnson, which funded the development and conduct of this study and manuscript. F.L. was an employee of Analysis Group, Inc., at the time the study was conducted.
Funding
This study was funded by Johnson & Johnson. The study sponsor was involved in several aspects of the research, including the study design, the interpretation of data, and the writing of the manuscript. All authors contributed to the development of the manuscript and maintained control over the final content.
Availability of Data and Materials
The data that support the findings of this study are available from Precision Point Specialty Analytics (https://specialtynetworks.com/member-solution-pps-analytics/) and Komodo Health (https://www.komodohealth.com/). Restrictions apply to the availability of these data, which were used under license for this study.
Human Ethics and Consent to Participate
The study was considered exempt research under 45 CFR § 46.104(d)(4) as it involved only the secondary use of data that were de-identified in compliance with the Health Insurance Portability and Accountability Act (HIPAA), specifically, 45 CFR § 164.514.
Previous Presentations
Part of the material in this manuscript was presented as a poster at the Society of Urologic Oncology Annual Meeting, held December 2-5, 2025, in Phoenix, Arizona, USA.