


BACKGROUND
Healthcare-associated infections (HAIs), which are infections contracted in hospital while in care for another condition, represent a significant clinical and economic burden to hospitals and their patients.1 Collecting data on HAIs is complex, and currently there are no established standards for systematically reporting HAIs, making it difficult to estimate the global burden of HAIs.1,2 According to the WHO, HAIs affect 5.1% to 19% of hospitalized patients worldwide, and the prevalence and nature of HAIs are closely linked to economic development and quality of care. In the United States, the annual economic burden of HAIs has been estimated to range between US$28 billion and US$45 billion, with HAIs affecting 2 million patients and causing 90 000 deaths yearly.3 Costs vary from prolonged impatient stay, long-term disability, lost productivity, and death.1,4 Becoming more pertinent are the additional use of antibiotics and development of antimicrobial resistance despite increased emphasis on handwashing, sterilization, and terminal cleaning.1,4
Many developed health care systems have started to move away from fee-for-service payment models toward payment-for-performance, in hope of improving patient care and curbing costs.5–7 In the United States, the Centers for Medicare & Medicaid (CMS), which oversees United States federal health care programs, is now denying payment for treatment of certain HAIs.8 Since 2012, CMS has been applying a hospital value-based purchasing (VBP) model, where acute-care hospitals are paid according to their performance.9 Hospitals are compared to benchmarks defined for four domains: clinical care; person and community engagement; safety; and efficiency and cost reduction. Hospitals ranking in the worst performing quartile are sanctioned through a 1% reduction in payment.10 Furthermore, payments are denied for readmission following certain procedures, such coronary artery bypass graft surgery (CABG).9,11 Similar measures have also been undertaken by private payers in Australia, where Medibank introduced quality of service requirements in 2015 when payments for additional costs due to HAIs are denied.12 In the United Kingdom, readmissions within 30 days due to a surgical-site infection are not reimbursed.13
Shifting (at least partially) the cost impact from payers to providers may reduce national spending on health care, but it puts additional strain on hospitals and their budgets. Such performance penalties are complex to forecast and challenging to take into account in the budget. With a poor performance rating also impacting patient confidence, hospitals are searching for affordable ways to reduce HAIs.14–17
Sternal-wound infections (SWIs), which can occur after cardiac surgery, are a major and well-defined contributor to the burden of HAIs.18 Unlike most HAIs and surgical-site infections, the definition of SWIs is generally more consistent across health care systems. About 0.5% to 8% of patients are at risk of developing a superficial SWI in the pectoralis fascia, the subcutaneous tissue, and the skin.19–21 Superficial SWIs are often easily treatable with topical wound care and antibiotics.22 However, more severe infections, such as mediastinitis or deep SWIs (DSWIs), are associated with high morbidity and mortality.23 According to a 2015 review by Cotogni et al, 0.5% to 6.8% of cardiac surgery patients develop DSWIs, with in-hospital mortality rates ranging from 7% to 35%.20
SWIs come at a great cost with increased length of stay (LOS), high readmission rates, and reduced patient quality of life, which can fall below presurgical levels.24 CABG is one of the most commonly performed cardiac surgeries. It is a universally accepted, highly reported, and complex surgical procedure. Thus, it is well suited for comparisons of global SWI rates.
CABG is a suitable setting for exploring the introduction of new interventions that could reduce the burden of SWIs. The introduction of beneficial interventions can, however, be impaired due to cost concerns. VBP involves a (generally low) base purchase price and a final price that is calculated from the value it provides to the purchaser—in this case hospitals—after extended use. VBP helps to ensure low financial risk to hospitals. Any additional savings derived from the new intervention could be shared between the purchaser and seller. If no benefit is derived, then the seller receives no additional payment beyond the base purchase price.
The focus of this study was to evaluate the global burden of SWIs after CABG using comparable mature health care systems. The premise was to provide hospitals with a foundation when considering strategies to reduce their incidence of SWIs and corresponding costs in a VBP model.
METHODS
Setting
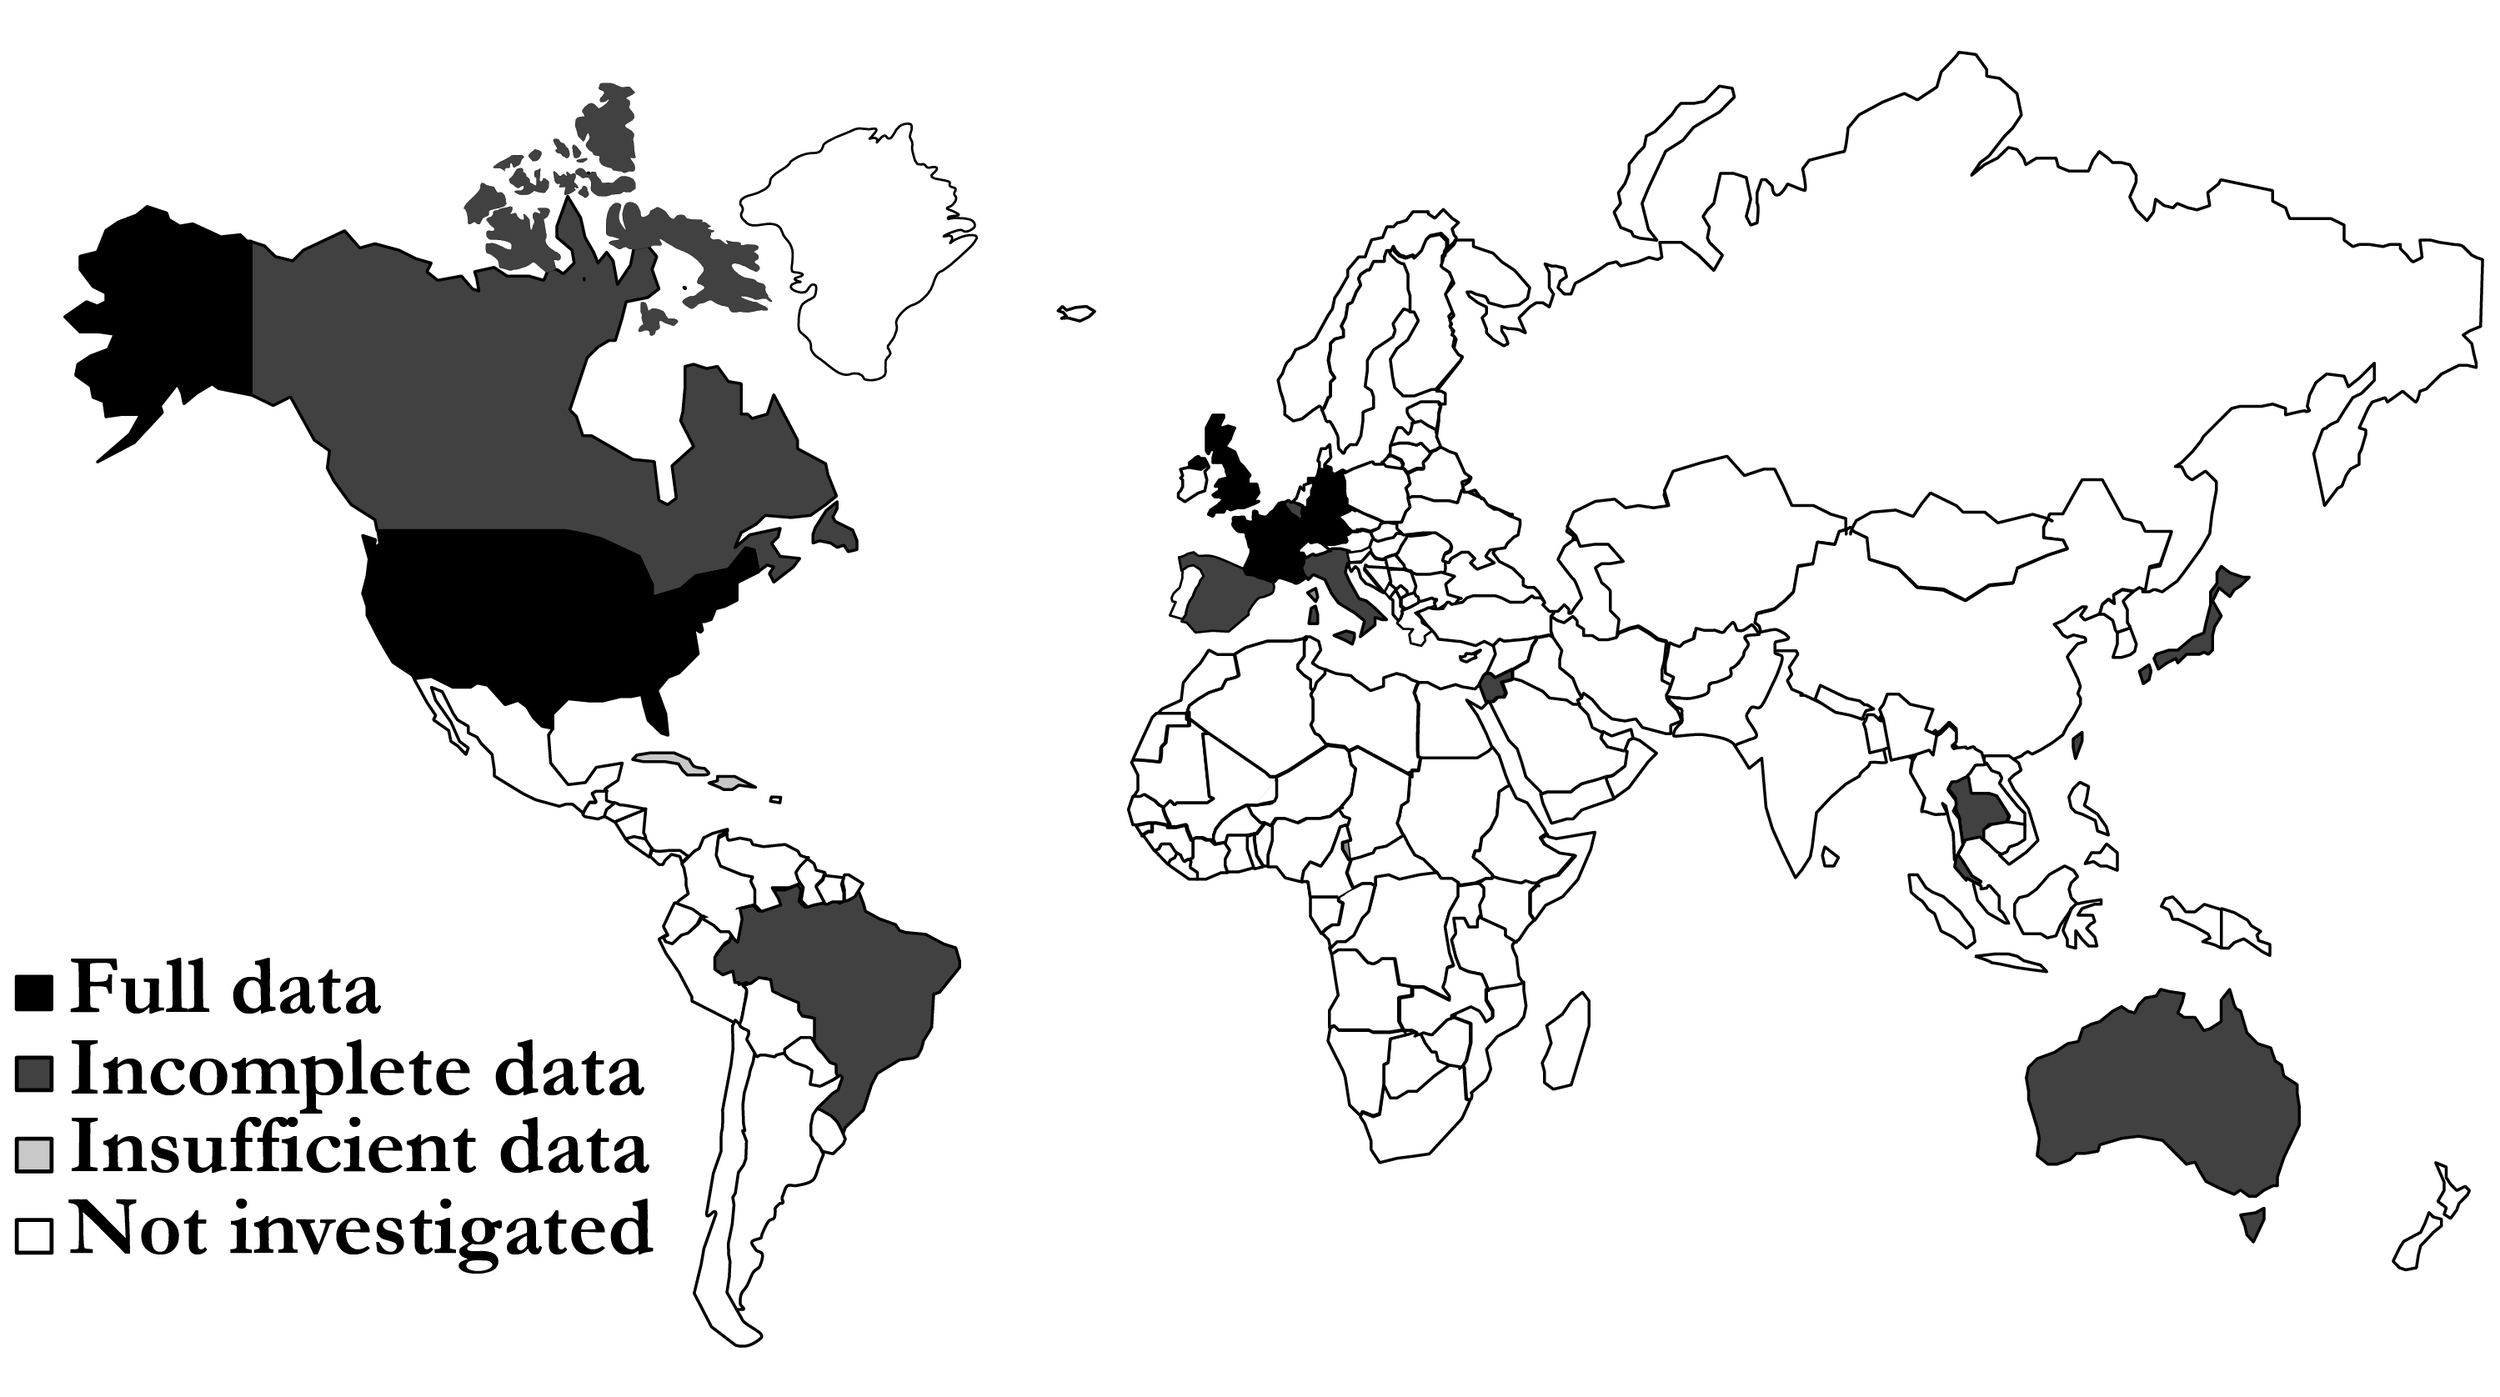
This study assessed the burden of SWIs after CABG in countries with mature health care systems, as defined by the 2017 Global Access to Healthcare report of The Economist Intelligence Unit.25 The report identified 15 countries with mature health care systems according to their Global Access to Healthcare Index: the Netherlands, France, Germany, Austria, the United Kingdom, Canada, Cuba, Italy, Japan, Spain, the United States, Brazil, Israel, Taiwan, and Thailand.
Model Structure
We defined the burden of SWIs in three ways: (1) additional length of hospital stay, in the intensive care unit (ICU) or general ward (GW); (2) readmissions; and (3) additional cost of hospital care. To estimate the burden in each country, a Markov model with states representing the CABG-care pathway was used. This Markov model was adapted from a US-specific model published by Saunders and Lankiewicz.26 Here the model was generalized for countries with similarly mature health care systems.
The analysis was completed as follows: A patient entered the model at surgery and was then taken to the ICU, where they received mechanical ventilation. During the time in ICU, the patient recovered sufficiently to be taken off the ventilator, discharged to the GW, and then discharged home. At all times, the patient was at risk of developing either a superficial SWI or a DSWI and dying. The cumulative incidence of SWI over time postsurgery was taken from Lankiewicz et al.27 The cumulative incidence curve was modeled using a dose–response Hill curve found to be most representative of the input data using CurveExpert Pro (Hyams Development, Chattanooga, TN), with alpha 2.96x10⁻³⁰, theta 6.93, eta 1.08, and kappa 23.73. The curve was assumed to be consistent across countries, but it was adjusted up or down by a percentage factor for each country so that it provided the correct incidence of SWIs. Specifically, if country-specific data had an SWI incidence of 2.4% at 30 days, and the cumulative incidence curve gave an incidence of 4.8% at 30 days, then each value derived from the cumulative incidence curve would be multiplied by 0.5 (2.4/4.8). Probabilities of progression through the different stages of the modeled pathway were country specific, as were the additional LOS associated with SWIs, the cost of ICU and GW days, and the number of CABG procedures.27 All costs were converted to 2017 US$ using market exchange rate values at mid-range for the year.
Model Inputs
To identify country- and hospital-level data to populate the model, a review of the literature was performed for CABG surgeries, SWIs, DSWIs, SWI follow-up, LOS, and daily costs of ICU and GW. The literature review was performed in PubMed and Google Scholar by DB, MB, and PJM, with extracted country data checked for accuracy by a second author: either RS, MB, DB, or PJM. Countries in which at least 5 (of the 10 country-specific) parameters were identified were included in the model. Missing data for the retained countries were calculated using the median and interquartile ranges (IQRs) of values from countries for which data were available. In values for which more than one study was found, the midpoint was used. The robustness of the model was assessed using probabilistic sensitivity analysis with 52 iterations per country.
VBP
VBP levels were estimated using three assumptions: (1) no purchasing hospital would commit all the estimated cost burden to preventative measures; (2) available funds would be split over multiple interventions; and (3) any purchase agreement would include a cost of intervention per patient (CIPP) and a share in savings generated from reduced SWIs. The last item is the VBP, which is paid out only if the intervention meets its stated target. The potential purchase CIPP and VBP were calculated using the following formulas:
CIPP= (1− RRINTSWI)⋅CSWI⋅rSWI⋅SPURVBP100NINTVBP
VBP=(rSWI⋅NPT⋅CSWI⋅(1− RRINTSWI))−(CIPP ⋅ NINTVBP⋅NPT)(100⋅ NINTVBP)SSAVVBP
where for the CIPP formula, is the relative risk of SWI events when using the intervention; is the cost per SWI; is the share of the SWI cost allocated to purchase of interventions under the VBP scheme; and is the number of interventions being considered. When calculating the VBP, is the SWI rate at the hospital (inpatient events plus readmissions); is the number of patients in the target population; and is the share of the cost savings being committed if an intervention meets its target under the VBP scheme.
Scenario Analysis
The following scenarios were considered: (1) 50% of the cost burden is made available for VBP of two interventions with a 15% savings share on success, and (2) 30% of the cost burden is made available for VBP of two interventions with a 25% savings share on success. All CIPP and VBP calculations assumed a hospital performing 1000 CABG procedures per year, were performed on the results of the probabilistic sensitivity analysis, and are presented as the median and range.
RESULTS
Required data were identified for France, Germany, the Netherlands, the United Kingdom and the United States (Figure 1). One parameter was missing for Australia, Canada, Italy, Japan, Spain, and Taiwan; two are missing for Israel and Brazil; and three are missing for Thailand. No data were identified for Cuba. Extracted data showed that there was a high variability in prevalence of CABG procedures between countries. Germany had the highest rate with 61.4 CABG procedures per a population of 100 000, whereas Taiwan had the lowest with 6.4 per 100 000.28,29 Similarly, high variability in relative additional LOS was associated with superficial SWIs, ranging from 2 days in Spain to 49 days in Japan.28,30 The prevalence of deep sternal wounds, which impacted LOS and readmission rates, ranged between 3.4% (the Netherlands) and 0.8% (the United Kingdom and Thailand, Figure 2). The data used in the analysis can be found in the Supplementary Material, Table S1.

The model estimated the total burden of CABG-related SWIs in target countries to be US$557.7 million, with 60% of the burden (US$336.0 million, Table 1) located in the United States. Taiwan had the lowest burden, estimated at US$1.5 million. The cost per SWI was highest in Japan (US$54 180) and lowest in Brazil (US$8172, Table 1). The median cost per SWI across the analyzed countries was US$13 995 (IQR US$8172; US$23 590). When the total SWI burden was normalized by the procedure volume, the burden was the highest in Japan (US$2795 per procedure; Table 1) and in the United States (US$2113) and the lowest in the United Kingdom (US$436) and France (US$440). The model showed when SWI costs were estimated per CABG procedure, France had the lowest SWI cost per procedure and Japan had the highest (Table 1). In Japan and the United States, costs per day for ICU and GW care were much higher than in the other countries in the model.
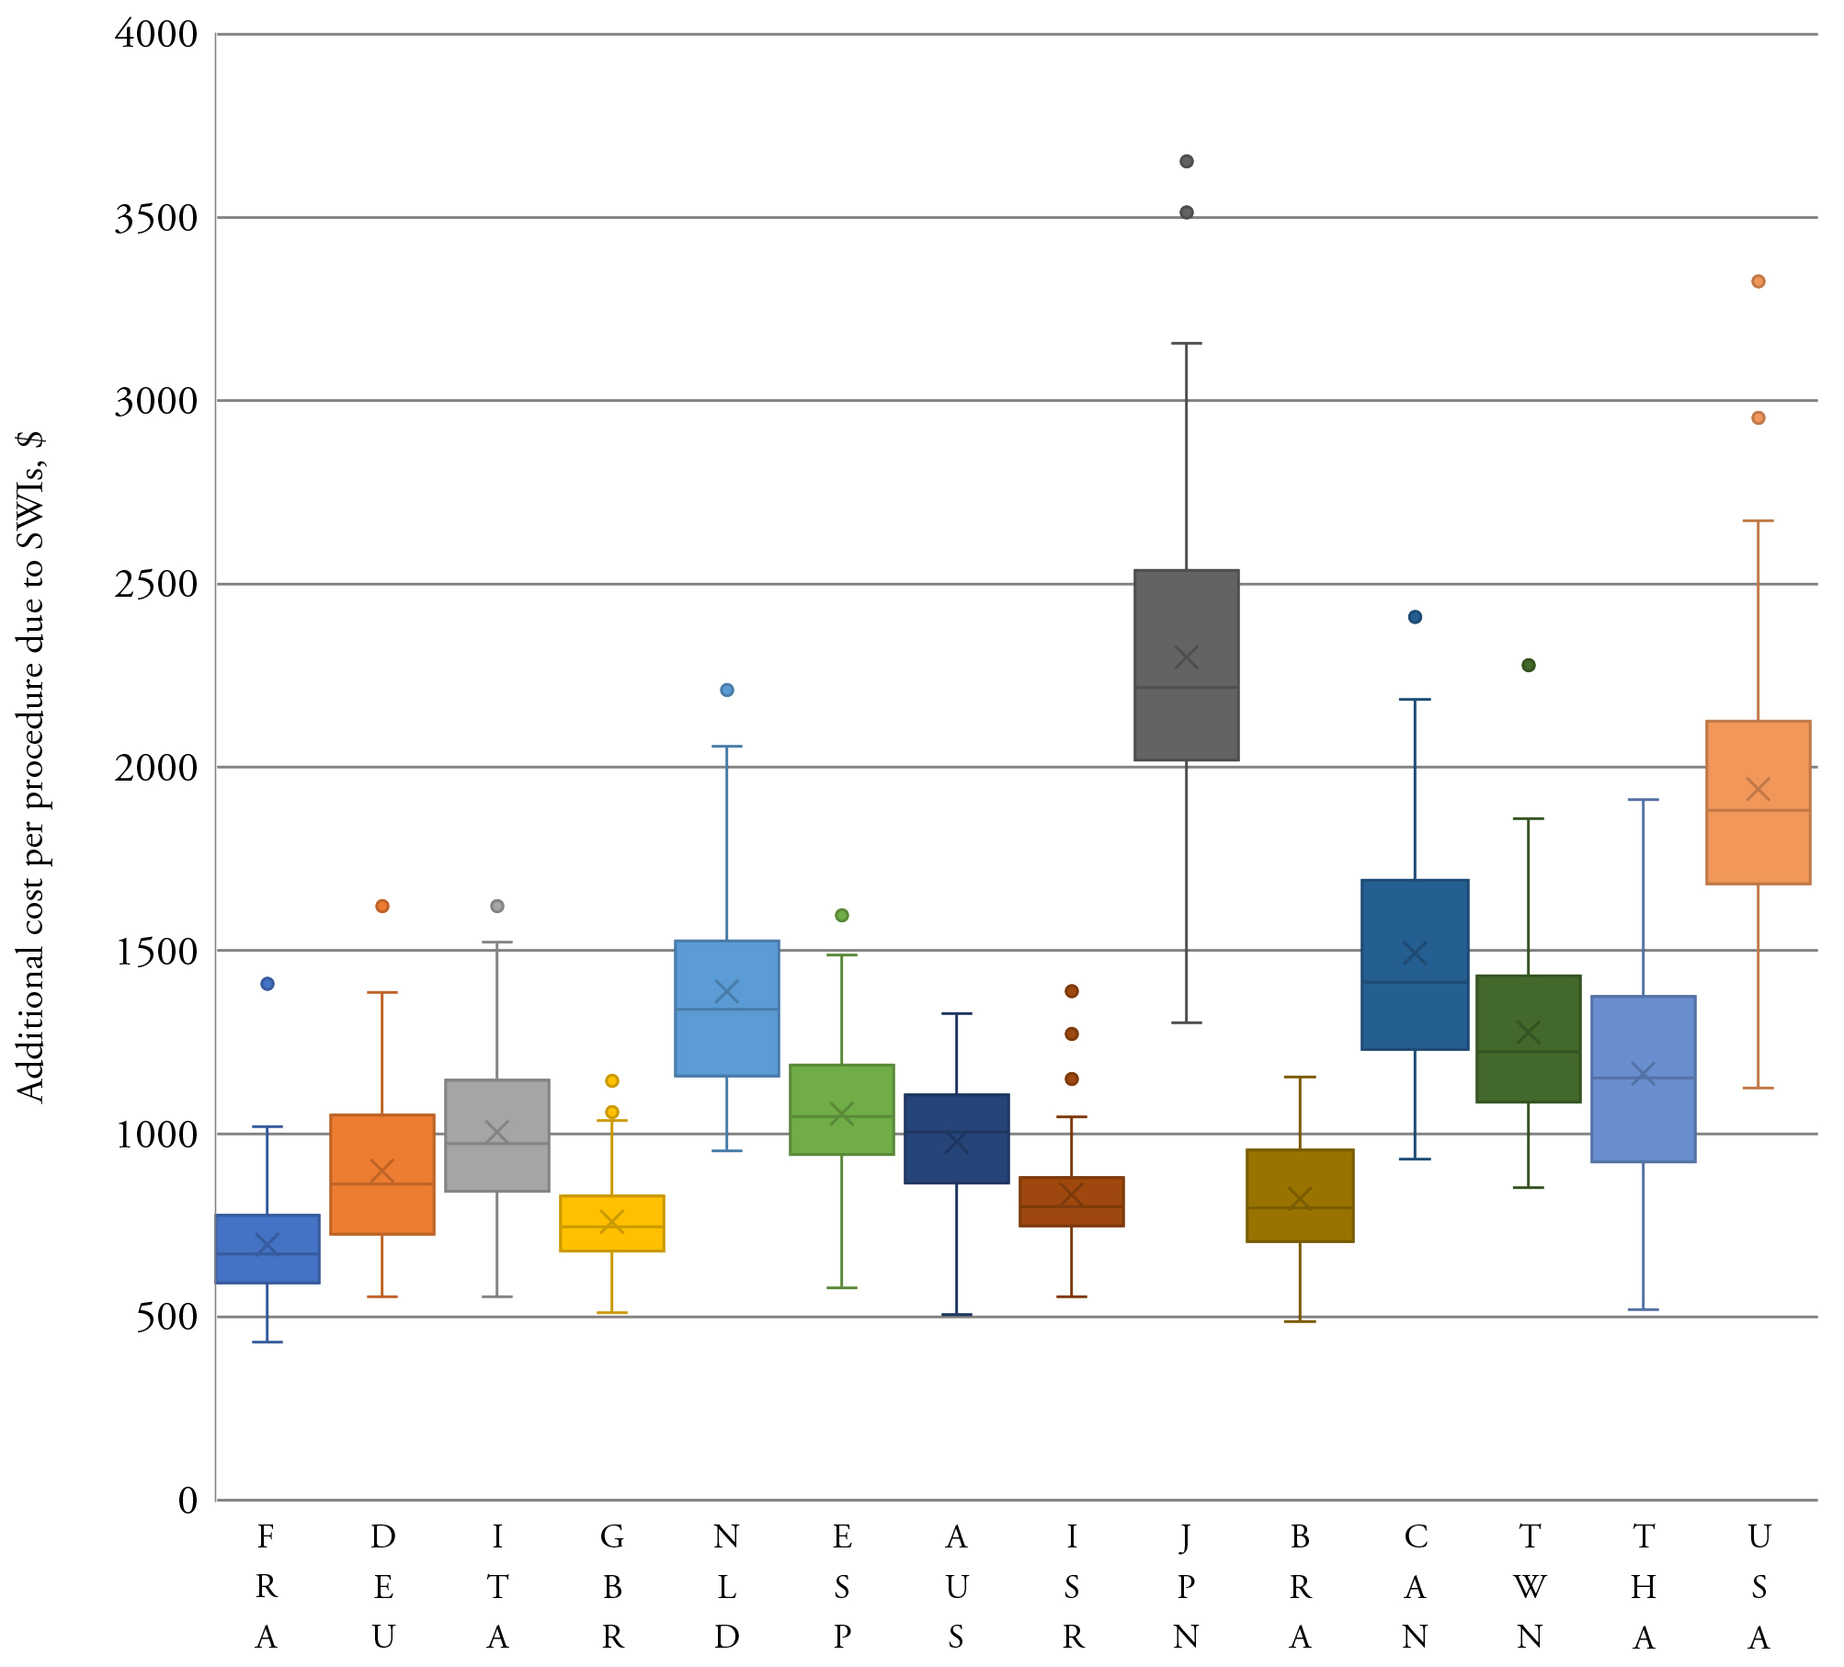
The results were generally robust to changes in model parameters during sensitivity analysis. The estimated cost of a SWI per CABG was consistently higher in Japan and the United States compared to other countries analyzed (Figure 3). The lower bound of the IQR for these two countries was more than the upper bound for all other countries. Even at the lowest estimate, the overall cost and resource use burden of SWIs following CABG in the United States was far greater than in any other country (Table 2). The total median burden over all analyzed countries was: US$529 million, 57 994 ICU days; 321 973 GW days; and 9418 readmissions.
The potential for VBP to help combat postsurgical infections was assessed based on the burden of SWIs following CABG. We provide a worked example for Spain, where the cost of an SWI was estimated at US$12 008 Table 1). A Spanish hospital with an inpatient SWI rate of 4% and with 1.6% readmissions, total 5.6% —that was looking to invest 30% of potential savings in three interventions targeting a 25% reduction in SWIs —would have: US$16.81. Given the fact that the hospital performs 1200 CABG procedures per year and is offering a further 30% of any savings as a VBP the potential per intervention US$ 14 121.84. If successful, the hospital would realize savings of US$87 036 per year.
Under scenario 1, the median (range) CIPP for an intervention reducing the SWI rate by 20% was from US$34 (US$22–US$70) in France to US$111 (US$65–US$183) in Japan (Table 3). If the intervention succeeded in reducing the SWI rate by 20%, a median VBP of between US$5044 (France) and US$16 629 (Japan) would be received; the median hospital saving would be between US$57 165 (France, US$57 per patient) and US$188 460 (Japan, US$188 per patient).
Under purchasing scenario 2, the median CIPP was lower than in scenario 1. The CIPP ranged from US$20 (US$13–US$42) in France to US$67 (US$39–US$110) in Japan (Table 3). The VBP was generally higher, as was the hospital saving, if interventions met their target under scenario 2. With a 20% reduction in the SWI rate, the median hospital savings ranged from US$70 616 (US$71 per patient) in France to US$232 804 (US$232 per patient) in Japan (Table 3).
DISCUSSION
SWIs after CABG pose a heavy clinical and economic burden on hospitals. Our study found that countries with mature health care systems incurred a median cost of US$13 995 (IQR US$8172; US$23 590) per SWI. Costs varied according to the individual country care pathways; in Japan and Australia, costs incurred were largely due to the extended LOS to treat DSWIs (averages of 66 and 53.2 days respectively).31,32 In the United States, in addition to the high cost of care, readmission costs were 10 times higher than in France and Canada and three times higher than in Germany.
The cost per SWI was the highest in the United States at US$36 768 per case, similar to hospital-acquired Clostridium difficile infection, which has been reported to be US$34 157 (90% CI: US$33 134, US$35 180).33 As CMS moves forward with the Hospital-Acquired Condition Reduction Program, thereby reducing payments to the worse-performing quartile of hospitals with regard to their hospital-acquired conditions score, hospitals may choose to focus on infection reduction measures. Similar systems are in place around the globe, and there will be debate within hospitals as to whether reduction should focus on specific areas with achievable goals or on hospital-wide systems.
There has been published success in reducing severe post-CABG infections, with studies demonstrating substantial reduction in DSWIs. Implementing a quality improvement process, a regional US medical center managed to achieve close to zero DSWIs.34 The authors used a bundled approach that included a multidisciplinary collaboration and a change in care pathways. The interventions included standardization of processes, new suture technique with braided triclosan-coated suture, silver-coated midsternal dressing, disposable electrocardiogram leads and wires, an insulin infusion protocol, chlorhexidine mouthwash, preoperative vancomycin, preoperative bath, and patient education.34 Similar achievements were made in Israel with an implemented wound-care protocol, the use of chlorhexidine–alcohol, and the exclusion of obese and diabetic women from bilateral internal thoracic artery graft.35 In both studies, it was a combination of changes that lead to success.
Such extensive updates of the care pathway may not be feasible in all institutions. Any intervention to reduce the burden of SWIs would, however, be of benefit if it were priced appropriately. Studies have shown that a single intervention can be effective at reducing infection rates, such as introducing 24-hour IV antibiotic prophylaxis,36 local gentamicin sponges,37,38 interlocking figure-eight and nitinol flexigrip closure,36,39,40 and single-use ECG cables and leads.26,34 Using equations provided in the methods section and our estimates of the SWI burden, providers can calculate how much they may pay on a per patient basis for implementing one or more of these interventions. Given the high cost burden of SWIs, assigning 30% of the estimated savings toward purchasing two new interventions resulted in a viable cost of between US$11 (lowest estimate, France) and US$110 (highest estimate, Japan) per patient. The lowest of these costs per patient likely already covered the standard purchase cost for a number of available options.
With VBP, however, the simple purchase price is not the end of the story. Providers need to monitor and track their progress on infection rates, so that the benefits of value-based and risk-sharing contracts can be leveraged. Sellers also need to remain engaged, promoting continuing education and correct use of the product to see any additional value returned.
LIMITATIONS
Our results were drawn from a simulation model and do not capture all aspects and subtleties of real-life care. The probabilities of moving from one health state to another were taken from published peer-reviewed studies, and for the feasibility of the model it was assumed that average patient characteristics and risk factors for developing an SWI were the same between countries. Risk factors modeled included morbid obesity (>35 kg/m2) and presence of diabetes; less prevalent comorbidities—such as chronic obstructive pulmonary disease, kidney disease, or peripheral vascular disease—were not included.20 There was uncertainty about some model parameters, with limited data available for numbers of days to treat SWIs (3 out of 14 countries had missing values) and DSWI (5 out of 14 countries), as well as for cost per day for care on the GW (3 out of 14 countries had missing values). The latter may be due to analyzed countries having their own hospital data collection systems only intended for policy implementation purposes, and our search was limited to the English language.41,42 Finally, our model assumed an equivalent care pathway in all settings, but care delivery likely varies (if only minorly) among health care systems, hospitals, and care units.6,43–45
CONCLUSIONS
SWI and DSWI have a high cost, with a median of US$13 995 per case and US$900 per CABG procedure. The overall cost was largely due to increased cost of care and LOS. The cost of readmissions was also a considerable concern. As hospitals are becoming more and more accountable for their outcomes, they may need to rethink care delivery pathways and invest in new procedures and equipment. Reduction of DSWIs is possible but requires investment in both process and infection prevention products.
IMPLICATIONS
SWI is an area of care where VBP could be implemented, making care improvement possible with limited financial risk to hospitals.
DISCLOSURES
DB has no competing interests to declare. JL was an employee of Cardinal Health, the research funder, at the time of writing. PJM has consulted with Cardinal Health. RS is the owner and MB is an employee of Coreva Scientific, a health-economics consultancy that received fees for developing the Markov model and undertaking this research.