BACKGROUND
The World Health Organization declared COVID-19 a global pandemic in March 2020. The disease has so far affected approximately 761 071 826 people and contributed to 6 879 677 deaths globally as of March 21, 2023.1 Diabetes is a common comorbidity, reported in approximately 5% to 36% of patients with COVID-19.2–5 The comorbidity burden and diabetes-related complications are expected to increase the risk of adverse outcomes and raise the healthcare resource utilization (HCRU) and costs among patients with COVID-19. Numerous studies have shown that patients with diabetes are at higher risk for developing severe COVID-19 and have a higher risk for increased mortality compared with those without diabetes.6–9 A study reported that the cost per hospital admission during the first wave of COVID-19 was remarkably higher for patients with type 2 diabetes mellitus (T2DM) compared with those without T2DM: EUR €25 018 for those with optimal glycemic levels, €46 130 for those with suboptimal glycemic levels compared with patients without diabetes (€16 993).9 In addition, a poor prognosis in patients with COVID-19 and diabetes is suggested to be linked to other comorbidities commonly present with diabetes mellitus, such as cardiovascular disease (CVD).6
Cardiovascular disease affects 32.2% of patients with T2DM globally and is a major cause of death and disability.10 Two separate meta-analyses (N = 65 484 and 4448 patients with COVID-19, respectively) have shown that pre-existing CVD was associated with a high risk of mortality and severe COVID-19.11,12 In a study in Bangladesh, the co-occurrence of CVD and diabetes in patients with COVID-19 was one of the main predictors of poor prognosis and mortality (odds ratio [OR]: 6.98; 95% CI: 4.21-7.34).13
The emerging evidence explains the adverse impact of both T2DM and CVD on COVID-19 outcomes.6–8,11,12 However, the impact of concurrent CVD+T2DM in patients with COVID-19 is evaluated in a limited number of studies13; in particular, the data regarding HCRU and costs are scarce. The current retrospective database study was performed to compare the economic burden, including all-cause and COVID-19–related HCRU and costs, in 3 COVID-19 patient cohorts—those with pre-existing T2DM + CVD, T2DM-only, and neither T2DM/CVD.
METHODS
Study Design and Settings
This was an observational cohort study of patients with COVID-19 using the data from the Healthcare Integrated Research Database (HIRD®), a proprietary insurance claims database. The HIRD is an administrative claims database of medical, pharmacy, and beneficiary eligibility and laboratory results data from commercial and Medicare Advantage health plans with members in all 50 US states. Mortality status was determined from a combination of the Social Security Death Index, claims-based inpatient discharge status, reasons for health plan disenrollment, and third-party obituary data. The HIRD is also linked to the 2017 American Community Survey for census block group-level socioeconomic status.
The data were used in full compliance with the relevant provisions of the Health Insurance Portability and Accountability Act. The study was conducted under the research provisions of Privacy Rule 45 CFR 164.514(e) and was exempt from Institutional Review Board review.
Patient Identification
Patients with COVID-19, as defined by at least 1 COVID-19 medical claim (International Classification of Diseases [ICD] Tenth Revision, Clinical Modification: U0.71) in inpatient/emergency department (ED)/outpatient settings or at least 1 COVID-19 positive laboratory-confirmed test (either molecular or antigen test) between March 1, 2020, and May 31, 2021, were identified from the database (Supplementary Figure S1). The index date was defined as the earliest date of a medical claim with a COVID-19 diagnosis or a positive laboratory test (either molecular or antigen test) for COVID-19. Patients were at least 18 years old as of the index date and had continuous health plan enrollment for at least 12 months before the index date. They were excluded if they had type 1 diabetes mellitus (T1DM) before the index date. T1DM was defined as having at least 2 claims for T1DM on distinct dates and at least 1 claim for insulin or an insulin pump and no fill for non-insulin diabetes medications except metformin.
Patients were classified into 1 of 3 cohorts by the presence of T2DM and CVD before COVID-19 infection. The first cohort, defined as T2DM + CVD, consisted of patients with COVID-19 who had both T2DM and CVD before the index date. T2DM was defined as having at least 2 claims for T2DM on distinct dates or at least 1 claim for T2DM and at least 1 prescription fill for antidiabetic medications (including insulin). CVD was defined as having at least 1 claim in the inpatient/ED setting or at least 2 claims in the outpatient setting for any of the following cardiac diseases/events or vascular diseases: myocardial infarction, stroke, transient ischemic attack, unstable angina, other cerebrovascular diseases, peripheral artery disease, coronary revascularization procedure, other coronary heart diseases, and heart failure. The second cohort, defined as T2DM-only, consisted of patients with COVID-19 who had T2DM and no claims for CVD before the index date. The third cohort consisted of patients with COVID-19 with neither T2DM nor CVD, who had no claims with a diagnosis for T2DM or CVD before the index date. The ICD-10-CM codes are included in Supplementary Table S1. Patients were followed from the index date until health plan disenrollment, end of the study period, or death, whichever occurred first.
Study Outcomes
The economic outcomes included all-cause and COVID-19–related HCRU and healthcare costs. The HCRU included inpatient hospitalization, ED visits, use of outpatient services, use of skilled nursing facilities, and frequency of pharmacy prescription fills. HCRU is presented as the number of patients with at least 1 encounter. The number of encounters and healthcare costs were reported as per patient per month (PPPM) to account for variable length of follow-up. In addition, average monthly healthcare costs of patients who were alive and not lost to follow-up were reported for up to 12 months following the index date after partitioning the follow-up duration into monthly intervals post-index. Total costs were defined as the sum of the medical and pharmacy costs for both the plan-paid (by all payers) and the patient-paid (sum of co-pay, coinsurance, and deductible) services. Healthcare medical encounters and costs were considered to be related to COVID-19 if the claims had a COVID-19 diagnosis code in the primary or secondary position. All costs were adjusted to 2020 US dollars based on the Consumer Price Index of the US Bureau of Labor Statistics.
Statistical Analysis
Categorical variables were presented as frequency and percentage, while continuous variables were presented as mean ± SD and median (interquartile range [IQR]). A comparative analysis between the 3 cohorts was conducted using a one-way analysis of variance or Kruskal-Wallis test for continuous variables and χ2 tests or Fisher’s exact test for categorical variables, as applicable.
Propensity score matching was performed to balance the baseline characteristics between the 3 study cohorts. A propensity score for each patient was estimated by fitting a logistic regression model. The dependent variable was cohort status; the independent variables included patient age on the index date, sex, geographic region, Medicare Advantage enrollment, baseline Quan-Charlson Comorbidity Index, and socioeconomic status. Patients were matched on propensity score using a prespecified caliper of 0.05. They were also exactly matched on COVID-19 diagnosis month and year to account for the COVID-19 treatment guidelines and vaccination, which evolved during the pandemic. Two propensity-matched cohorts were identified: 1:1 propensity-matched cohorts of neither T2DM/CVD vs T2DM-only, and another 1:1 matched cohort of neither T2DM/CVD vs T2DM + CVD. The common patients of both cohorts were identified to form a final 1:1:1 matched cohort. The balance between the matched cohorts was assessed using standardized differences. A standardized difference of more than 0.2 would indicate the possibility of an imbalance between cohorts.14
After matching, generalized linear models using a log link function and γ distribution were used to examine the healthcare costs for the 3 study cohorts while adjusting for potentially remaining residual confounding.
RESULTS
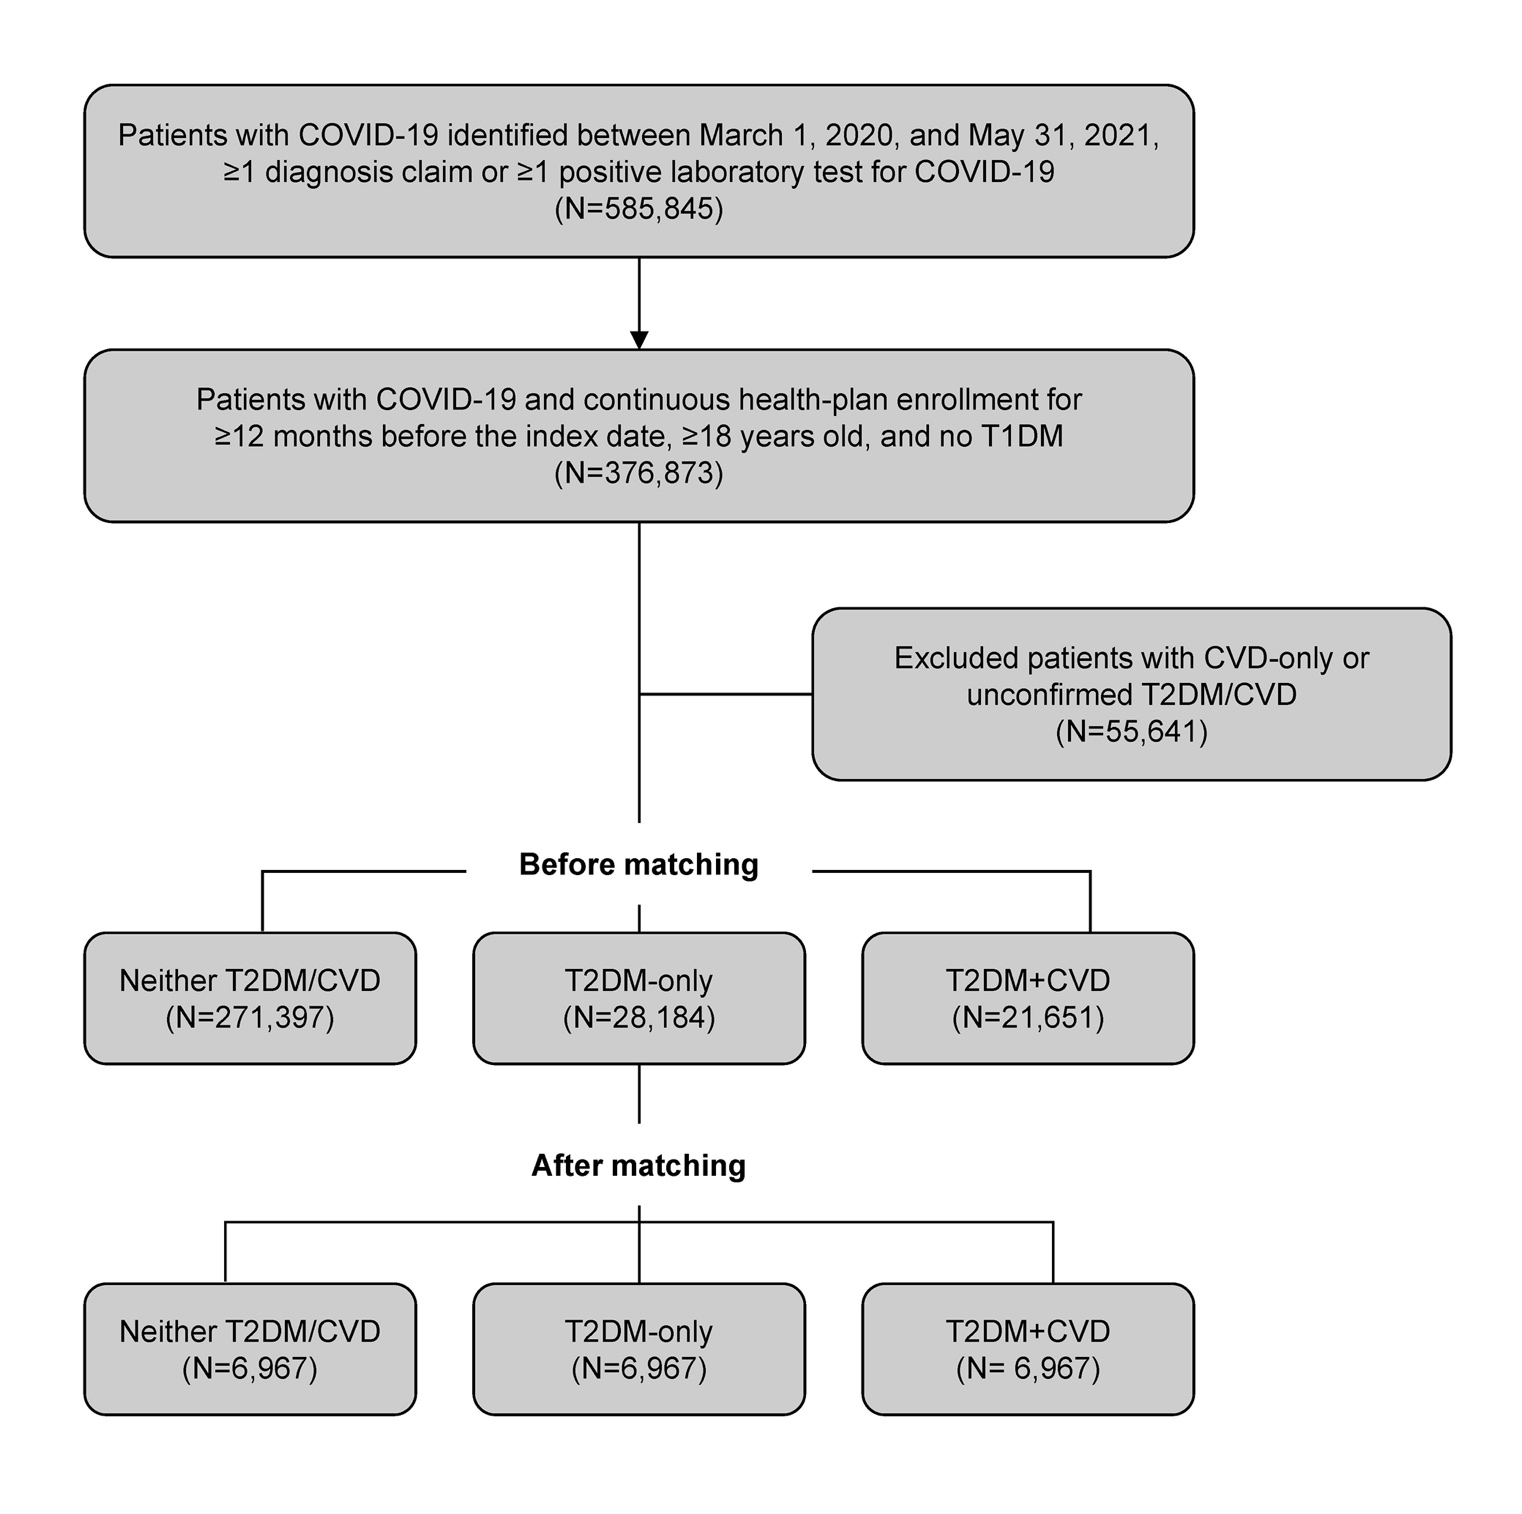
From the database, initially, 585 845 individuals with a COVID-19 diagnosis claim or positive COVID-19 lab test were identified. Of these patients with COVID-19, 376 873 had continuous health plan enrollment for at least 12 months before the index date, were at least 18 years old, and had no T1DM (Figure 1). After excluding 55 641 patients (patients with CVD only, only 1 claim for T2DM without antidiabetics, or only 1 outpatient claim for CVD), there were 21 651 patients with pre-existing T2DM + CVD, 28 184 patients with T2DM-only, and 271 397 patients with neither T2DM/CVD. After propensity score matching, the final matched sample comprised 6967 patients in each of the 3 cohorts.

Baseline Characteristics
The demographic and clinical characteristics are presented in Table 1. Before propensity score matching, patients with COVID-19 and pre-existing T2DM + CVD were significantly older on their index date than those with neither condition (69.9 ± 13.1 years, 54.5 ± 11.7 years, and 40.9 ± 14.5 years for patients with T2DM + CVD, T2DM-only, and neither T2DM/CVD, respectively; P < .001). Similarly, patients with COVID-19 and pre-existing T2DM + CVD had a greater comorbidity burden than those with neither condition. After propensity score matching, the patient demographics and comorbidity indexes of the 3 cohorts were well balanced. However, residual differences remained in several baseline clinical conditions, such as hypertension, obesity, and chronic kidney disease, which were more frequent in the T2DM + CVD cohort, whereas cancer was found more commonly in the T2DM-only cohort.
Healthcare Resource Utilization Following COVID-19 Infection
Before propensity score matching, 46.8% of patients with COVID-19 and T2DM + CVD were hospitalized (all-cause), followed by 18.0% of those in the T2DM-only cohort, and 6.3% of those in the cohort of neither T2DM/CVD. COVID-19–related hospitalization followed a similar trend, and the proportions of patients hospitalized in the 3 cohorts were 38.4%, 15.2%, and 4.3%, respectively (Supplementary Table S2). After matching, 34.2%, 26.0%, and 21.2% of patients were hospitalized for any cause in the T2DM + CVD cohort, T2DM-only cohort, and in the cohort of neither T2DM/CVD, respectively (Table 2). COVID-19–related hospitalization followed a similar trend, and the highest percentage of hospitalized patients was seen in the T2DM + CVD cohort compared with patients from the other 2 cohorts after matching (Table 2).
Before matching, 20.9% of patients with COVID-19 and T2DM + CVD were readmitted to the hospital (all-cause hospitalization) within 30 days of being discharged; a percentage that was considerably higher compared with 9.5% of patients with COVID-19 and T2DM-only, and 8.3% of patients with COVID-19 and neither T2DM/CVD. COVID-19–related 30-day readmission followed a similar trend, with the highest percentage of readmitted patients seen in the T2DM + CVD cohort compared with the other 2 cohorts (Supplementary Table S2). After matching, 17.5%, 11.9%, and 12.7% of patients were readmitted within 30 days (all-cause) in the T2DM + CVD, the T2DM-only, and the neither T2DM/CVD cohort, respectively. A similar pattern was seen for COVID-19–related 30-day readmission and the highest percentage of readmitted patients was observed in the T2DM + CVD cohort compared with the other 2 cohorts after matching (Table 2).
Before matching, the all-cause median duration of hospital stay was longer for patients with COVID-19 and pre-existing T2DM + CVD (7.0 days, IQR: 4.0-11.5 days), and for those with T2DM only (6.0 days, IQR: 4.0-10.0 days), compared with patients who had neither condition (5.0 days, IQR: 3.0-7.0 days). Similarly, the COVID-19–related median duration of hospital stay was longer among patients with COVID-19 and pre-existing T2DM + CVD (7.0 days, IQR: 5.0-13.0 days), and for those with T2DM-only (6.0 days, IQR: 4.0-11.0 days), compared with patients who had neither condition (6.0 days, IQR: 4.0-9.0 days) (Supplementary Table S2). After matching, the all-cause median duration of hospital stay was 6.0 days (IQR: 4.0-11.0 days) in patients with COVID-19 and T2DM + CVD, and in patients with COVID-19 and T2DM-only, and 6.0 days (IQR: 4.0-10.0 days) in patients with COVID-19 who had neither T2DM/CVD (Table 2). The COVID-19–related median duration of hospital stay in the 3 cohorts was 7.0 (IQR: 5.0-12.0 days), 7.0 (IQR: 4.5-12.0 days), and 6.0 (IQR: 4.0-11.0 days) days, respectively (Table 2).
The all-cause and COVID-19–related use of ED visits, telehealth visits, the number of in-person physician office visits PPPM, use of other physician services, use of skilled nursing facilities, and pharmacy prescription filling showed similar patterns, with the highest utilization observed in patients with COVID-19 and pre-existing T2DM + CVD compared with the other 2 cohorts before (Supplementary Table S2) and after (Table 2) propensity score matching analyses.
In summary, there was a trend for a higher all-cause and COVID-19–related utilization of healthcare resources among patients with COVID-19 and pre-existing T2DM + CVD, and in those with COVID-19 and T2DM-only, compared with patients with COVID-19 and neither T2DM/CVD, both before and after propensity score-matching analysis.
Healthcare Costs Following COVID-19 Infection
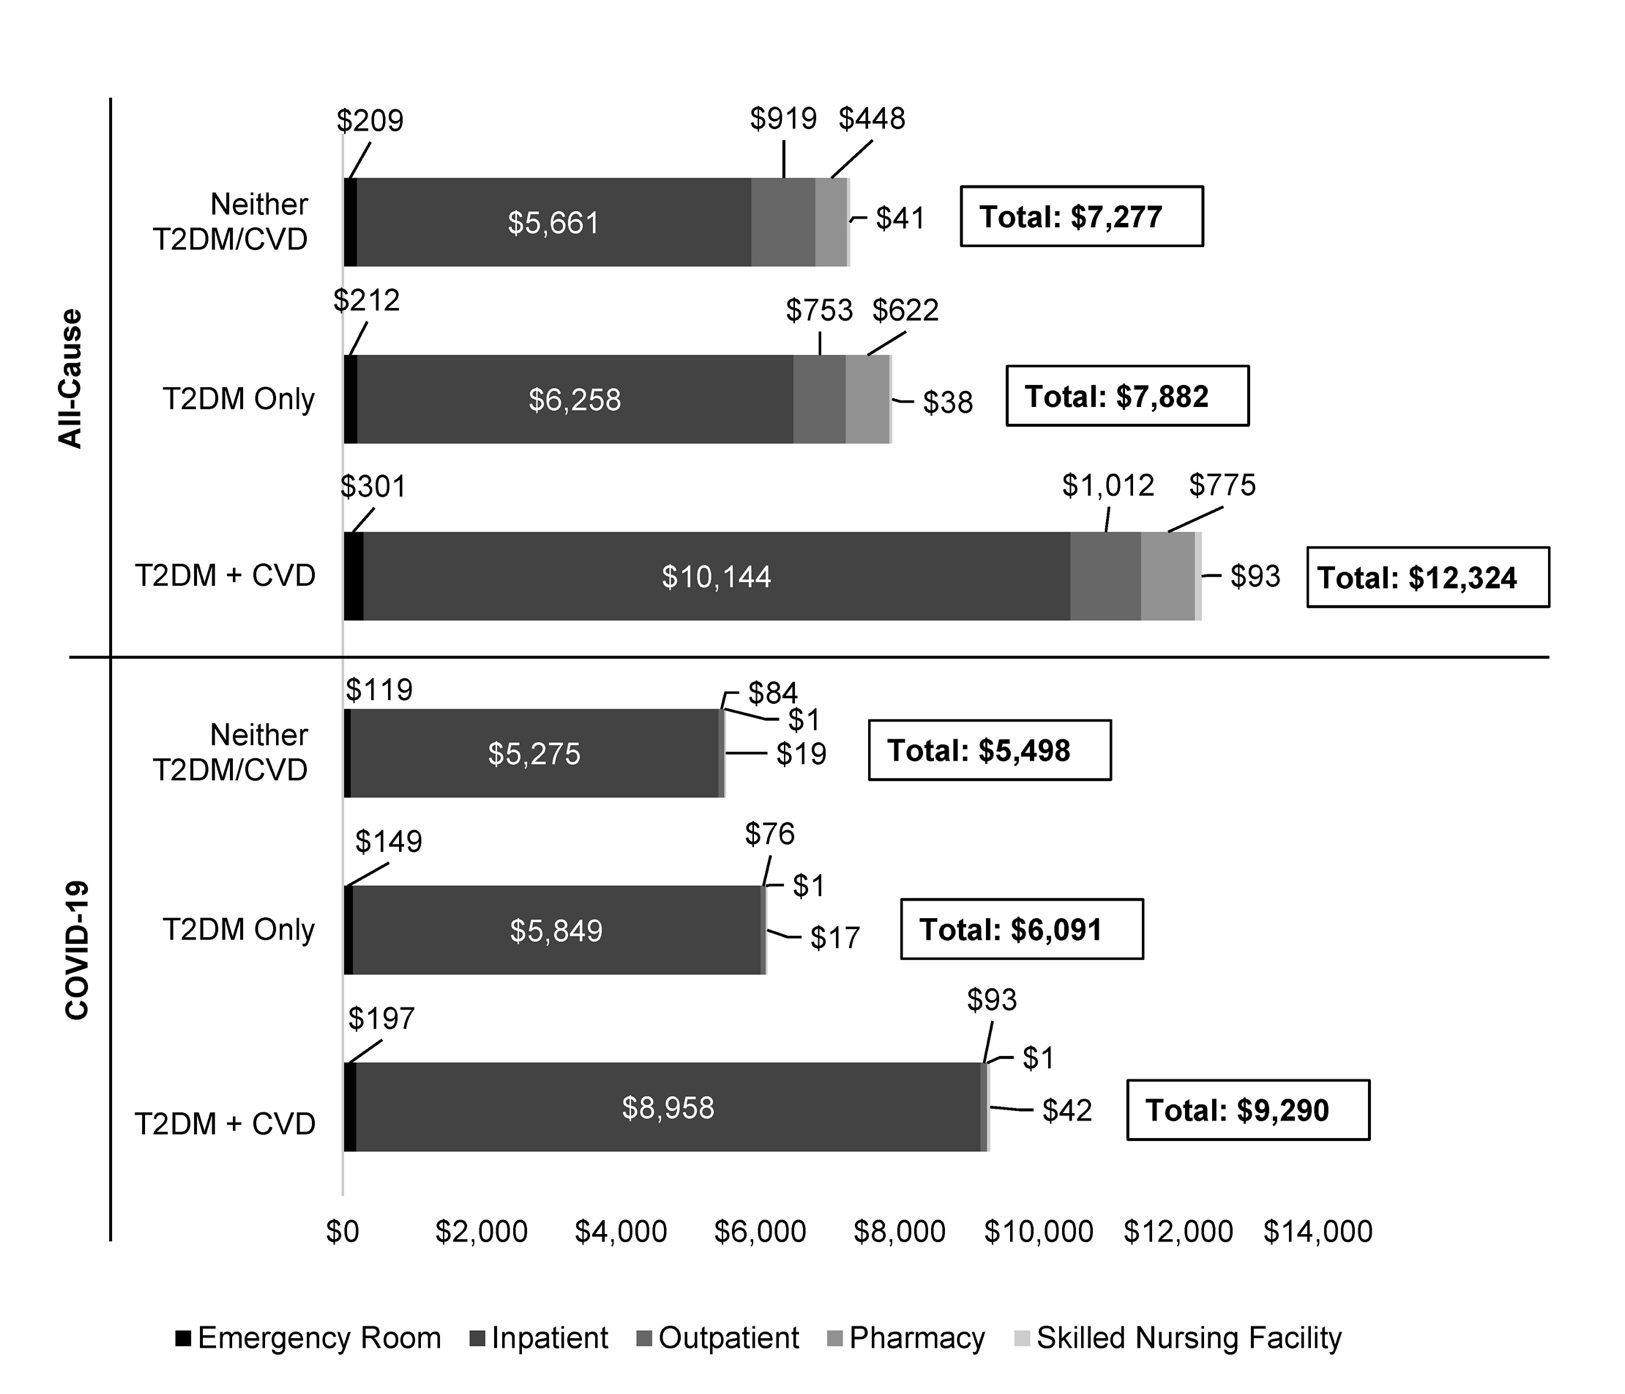
The average all-cause costs during follow-up, presented as PPPM, were US $14 790, $5717, and $1891 before matching (Supplementary Figure S2), and $12 324, $7882, and $7277 after matching (Figure 2), for patients with COVID-19 and pre-existing T2DM + CVD, COVID-19 and T2DM-only, and patients with COVID-19 and neither T2DM/CVD, respectively. The costs attributable to COVID-19 were 77.9%, 74.9%, and 63.7% of total all-cause costs before matching, and 75.4%, 77.3%, and 75.6% of total all-cause costs after matching for patients with pre-existing T2DM + CVD, T2DM-only, and patients with neither T2DM/CVD, respectively. Inpatient medical expenses accounted for most all-cause and COVID-19–related costs.

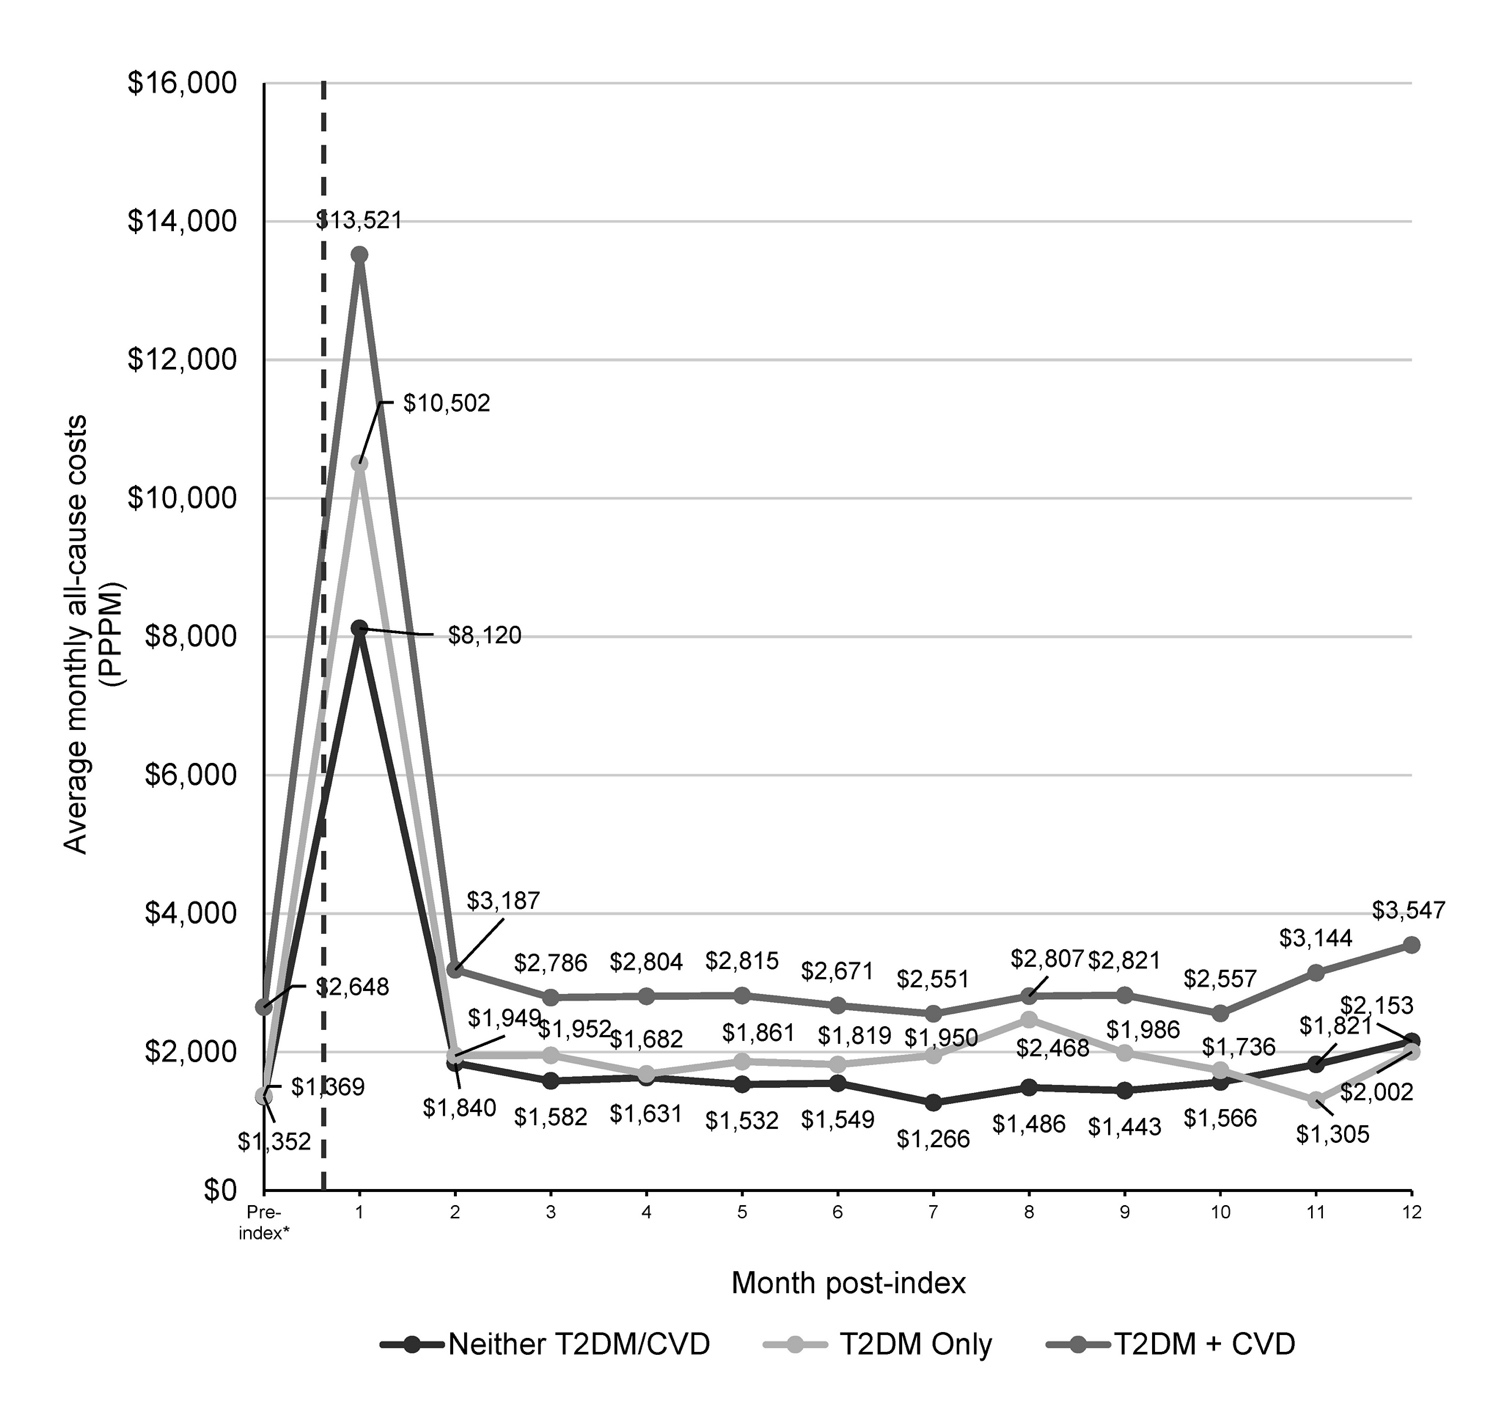
After the multivariable adjustment, patients with COVID-19 and pre-existing T2DM + CVD had 54% higher PPPM costs compared with patients with COVID-19 who had neither T2DM/CVD (all-cause OR: 1.54; 95% CI: 1.44-1.63). Similarly, patients with COVID-19 and T2DM-only had 21% higher PPPM (all-cause OR: 1.21, 95% CI: 1.14-1.28; COVID-19–related OR: 1.28; 95% CI: 1.17-1.39) compared with those with COVID-19 and neither T2DM/CVD (Supplementary Table S3). Factors associated with increased PPPM cost included age at least 55 years, male sex, patients in the 3rd quartile of socioeconomic status, baseline Quan-Charlson Comorbidity Index at least 1, and comorbid chronic kidney disease or prior occurrence of acute respiratory distress syndrome/respiratory failure. Patients with COVID-19 in the south and midwest of the US had lower PPPM costs than those in the west of the country. Patients with COVID-19 who enrolled in a Medicare Advantage health plan had lower PPPM costs compared with those enrolled with a commercial health plan, most likely due to differences in contracted rates. Similarly, compared with patients with COVID-19 in the 1st quartile of socioeconomic status, patients in 2nd and 4th quartiles of socioeconomic status had lower PPPM costs. The average monthly healthcare costs increased during the first month after contracting COVID-19, then decreased but remained above pre-COVID-19 costs in before (P < .05) (Supplementary Figure S3) and after (P < .001) matching analyses (Figure 3). The average monthly healthcare costs were highest for patients with COVID-19 with pre-existing T2DM + CVD compared with those in the other 2 cohorts before (Supplementary Figure S3) and after (Figure 3) propensity score-matching analysis.

In summary, among the 3 cohorts of patients with COVID-19, those with pre-existing T2DM + CVD had higher all-cause and COVID-19–related healthcare costs compared with those with T2DM-only, and those with neither T2DM/CVD, before and after propensity score matching analysis.
DISCUSSION
To our knowledge, this was the first study that evaluated HCRU and costs in patients with COVID-19 and pre-existing T2DM + CVD. Both before and after propensity score matching and multivariable adjustment, patients with COVID-19 and T2DM + CVD had higher HCRU and costs than patients with COVID-19 and neither T2DM/CVD.
In the present study, a higher percentage of patients were hospitalized or readmitted within 30 days of being discharged in the T2DM-only cohort compared with those in the cohort of neither T2DM/CVD. The healthcare costs were also higher for the patients in the T2DM-only cohort compared with those in the cohort of neither T2DM/CVD. These findings are in alignment with the adverse impact of diabetes on the HCRU and costs, which has been reported in the literature in patients with COVID-19.9,15,16 For example, Ko and colleagues estimated that individuals with diabetes were at greater than 3 times the risk for COVID-19–associated hospitalization compared to those without diabetes (adjusted risk ratio = 3.2; 95% CI: 2.5-4.1) across 12 states within the United States. These results were consistent with what Gregory et al observed in a large, single US healthcare system, with individuals with T2DM having greater than 3 times the odds of a COVID-19–associated hospitalization (adjusted odds ratio = 3.4; 95% CI: 2.5-4.6). However, more information was needed on the HCRU and cost burden associated with T2DM that is concurrently present with CVD in patients with COVID-19. The cost for disease management in patients with COVID-19 and T2DM was estimated by Bain and colleagues and shown to be higher in patients with pre-existing T2DM compared with those without T2DM.9 Our study showed an incremental increase in HCRU and costs in patients with COVID-19 and pre-existing T2DM + CVD compared with those with T2DM-only or neither T2DM/CVD.
The present study results confirm that pre-existing T2DM + CVD is associated with increased HCRU and costs in patients with COVID-19, highlighting the importance of proactive management of patients with COVID-19, which may include a comprehensive assessment of those with pre-existing T2DM + CVD presenting in the inpatient or outpatient setting, COVID-19 therapies suitable for this patient population, COVID-19 vaccination campaigns raising awareness for such patients, and optimal use of antidiabetic medications where appropriate. Glycemic control using sodium-glucose co-transporter-2 (SGLT-2) inhibitors and glucagon-like peptide-1 (GLP-1) receptor agonists are some of the recommended treatment approaches for patients with T2DM who have CVD comorbidity.17 A network meta-analysis showed that SGLT-2 inhibitors and GLP-1 receptor agonists effectively reduced the risk of cardiovascular and all-cause mortality in patients with T2DM + CVD.18 Such approaches could have a positive impact on cardiovascular outcomes in patients with COVID-19 who have pre-existing T2DM and concurrent CVD.19
Limitations
This study has a few limitations that require consideration. There is a possibility of underestimation or overestimation of costs, depending on how they were being reported, due to selection bias, as patients who did not seek medical care (including those who were not tested or did not report COVID-19 infection, or those with asymptomatic infections) would not have available data and therefore would not have been included.
There were confounding factors that we could not control for, such as incomplete clinical information on vaccine administration, because such information was underreported in administrative claims data at the beginning of vaccination administration. However, the 3 cohorts were matched on their COVID-19 diagnosis timing to ensure that they were comparable in terms of their opportunity for exposure to vaccine and treatment protocols, which changed throughout the pandemic. Also, diabetes severity was not accounted for in the matching or multivariate models. In addition, the study estimated the direct costs only; it did not account for any additional indirect costs or investigate the costs of the long-term sequelae of COVID-19. Moreover, the documented hospital length of stay could be biased as patients who died were likely to have a shorter length of stay than those who survived.
Finally, this study was limited to patients with Medicare Advantage and commercial health insurance coverage, which may reduce the generalizability of these results to other populations, such as traditional Medicare and Medicaid patients and the uninsured patient population.
CONCLUSIONS
The current study presents real-world data from a large commercial health insurance and Medicare Advantage population, estimating HCRU and costs for patients with COVID-19 and pre-existing T2DM + CVD. These patients have incrementally higher HCRU and costs compared with those with COVID-19 and T2DM-only, and those with COVID-19 and neither T2DM/CVD, even after accounting for baseline differences between groups. Our results highlight the need for healthcare systems and health insurance payers to adopt thorough assessment and management strategies to mitigate the economic burden associated with patients with COVID-19 who also have pre-existing T2DM + CVD.
Acknowledgments
Leena Patel, PhD, Chrysi Petraki, PhD, and Daria Renshaw from IQVIA provided medical writing and editorial support, which was funded by Carelon Research.
Funding
This study was funded by Boehringer Ingelheim with in-kind support from Elevance Health, Inc.