
INTRODUCTION
Congenital heart disease (CHD), the most common major birth defect, affects more than 40 000 babies born in the United States (US) annually.1,2 Currently, an estimated 2.4 million children and adults in the US live with CHD, at an estimated annual healthcare cost of $9.8 billion.3,4 Among newborns with CHD, approximately 20% have congenital pulmonary valve disease (CPVD) anomalies that affect the right ventricular outflow tract, including double outlet right ventricle, tetralogy of Fallot (ToF), congenital pulmonary stenosis, and pulmonary atresia.1,5–7 Annually, CPVD is diagnosed in over 7000 US births.8,9
While some cases involve “watchful waiting,” babies born with CPVD generally require intervention in the first year of life to obviate life-threatening morbidity. Some infants require emergent surgical establishment of the right ventricle to pulmonary artery connection, while the majority undergo palliative surgical repair to relieve pulmonary outflow obstruction.5,10 However, this procedure disrupts the native pulmonary valve apparatus and creates severe pulmonary regurgitation.11 Consequently, chronic pulmonary insufficiency leads to early-onset, progressive right ventricular enlargement.12,13 This volume overload leads to adverse myocardial remodeling, which can result in reduced exercise capacity, poor growth, and other symptoms of right-heart dysfunction during childhood.12
To address pulmonary valve dysfunction, patients with CPVD often require eventual pulmonary valve replacement. Unfortunately, existing valve replacement options (eg, off-label bioprosthetic valves, homograft donor valves) used in children often fail early due to multiple factors, including valve oversizing, rapid structural deterioration, thrombosis, infection and outgrowth of the prosthesis.14–18 Pediatric patients may face repeated pulmonary valve replacement procedures throughout childhood and adolescence, which carry medical risk and are physically, emotionally, and financially burdensome for patients and families.6,14,15,17,18 Therefore, a strategy that minimizes the lifetime number of interventions would be beneficial.12
Due to the high risk of early prosthetic valve failure and subsequent need for repeated invasive open-heart operations, clinicians typically only refer children with rapid disease progression for pulmonary valve replacement, while many patients are managed medically and undergo delayed intervention during late adolescence or early adulthood when an adult-sized valve can be implanted.19 Delaying treatment significantly increases the risk of irreversible right ventricular dysfunction, leading to reduced quality of life and potential for arrhythmias, heart failure, and premature death in adulthood.12,20
Due to cardiovascular morbidity, the burden of caring for patients with CPVD is substantial. While the cost of care has been estimated for recipients of specific CPVD procedures, there is a paucity of published research on the long-term economic impact of CPVD.21 This study intends to address this gap in the literature by assessing and estimating lifetime financial costs and burden of care in a real-world population of patients with CPVD from birth through age 65.
METHODS
Data Source
This retrospective, observational study used administrative claims data from the Healthcare Integrated Research Database (HIRD). The HIRD contains medical and pharmacy claims from a large, national commercial payor, representing over 90 million members across the US since 2006. Additionally, social drivers of health (SDoH) data collected from the American Community Survey are integrated into the HIRD at the census block group level. Most HIRD members are commercially insured (~90%), with the remainder covered by managed Medicare.22 The 2020 HIRD population was representative of the 2020 US census population in terms of sex, age, and geographic region of residence; the race/ethnicity distribution indicates slightly more non-Hispanic White members compared with the census.23 Management of all data and study materials conformed with Health Insurance Portability and Accountability Act (HIPAA) rules. A limited dataset, which excluded patient-identifying information, was used under a data use agreement with the covered entities; internal institutional guidelines exempted the research from ethics review based on US Health and Human Services Office for Human Research Protections regulations, including the HIPAA Privacy Rule.
Study Population
The study population included patients up to 65 years of age with at least 2 medical claims (inpatient, emergency department [ED], or outpatient) with a CPVD diagnosis at least 7 days apart between January 1, 2006, and April 30, 2024. A short (30-day) continuous health plan enrollment criterion was used to minimize potential selection bias associated with length of enrollment. The conditions used to identify CPVD diagnoses using International Classification of Diseases, Ninth Revision (ICD-9) or International Classification of Diseases, Tenth Revision (ICD-10) diagnostic codes are listed in Table 1. The index date was defined as the earliest claim with CPVD diagnosis. As CPVD is a congenital condition, there is no baseline period which could occur prior to the condition. The follow-up period included all claims from index until disenrollment, death, or end of study period (Supplemental Figure S1). Subgroups of patients with continuous health plan enrollment from birth through at least 60 months and 120 months, respectively, were included for sensitivity analyses to provide a longer-term analysis for as many individuals as possible.
Outcome Measures
Demographics including sex, race/ethnicity, geographic region, SDoH, and selected comorbid conditions of interest were captured. SDoH were reported as the socioeconomic status (SES) index from the ACS.
Healthcare resource utilization (HCRU) and healthcare costs, calculated from medical and pharmacy claims, were reported by categories: inpatient, ED, outpatient, and prescription medications. Healthcare costs, calculated from the total amount allowed for paid claims, represent both health plan and patients’ payments. HCRU and costs were reported as all-cause and CPVD-related. All-cause HCRU and costs included all claims regardless of diagnosis, procedure performed, or medication dispensed or administered. CPVD-related HCRU and costs included claims with the CPVD diagnoses used to define the cohort and related diagnoses (Supplemental Table S1).12,24–29 Additionally, specific CPVD-related procedures were included in CPVD-related HCRU/costs regardless of the diagnosis code associated with those procedure claims (Supplemental Table S1).
The age when individuals with CPVD are identified and followed in claims depends on when they are diagnosed and their health plan enrollment period; hence, we captured CPVD patients at varying ages and time horizons. To estimate lifetime costs associated with CPVD, age-based subgroups were adapted from published studies as follows: infants (<1 year), toddlers (1-4 years), children (5-12 years), adolescents (13-21 years), young adults (22-44 years), and middle-aged/older adults (45-65 years).4,14,30,31
Statistical Analysis
Demographics, baseline clinical characteristics, and outcomes of interest were described in univariate statistics. Categorical variables were described using frequency and percentage. Continuous variables were described with measures of centrality (means) and variance (SD), as well as medians and interquartile ranges (IQR).
All-cause and CPVD-related HCRU and costs were calculated per-patient-per-year by age category. Annual costs for each age group were multiplied by number of years within that category to estimate costs within the full age category time period. The costs for each full age category time period were summed to estimate lifetime costs through age 65 years. For the 60-month and 120-month sensitivity analyses, costs were captured for the entire duration of follow-up. Costs were adjusted to 2023 dollars based on the Consumer Price Index of the US Bureau of Labor Statistics for medical care. Sample selection, creation of analytic variables, and analyses were performed using the Instant Health Data platform (Panalgo).
RESULTS
Study Population
All eligibility criteria were met by 22 751 individuals with CPVD; overall, the prevalence of CPVD was 0.03% (22 751/69 677 013) (Table 1). The most common CPVD diagnoses included congenital pulmonary valve stenosis (N = 10 535; 46.3%) and ToF (N = 8406; 36.9%). The study population had a mean (SD; median [IQR]) duration of follow-up of 3.5 years (3.3; 2.5 [1.2-4.9]) (Table 2). For the sensitivity analyses, among individuals who met all eligibility criteria, 872 individuals had at least 60 months of continuous follow-up from birth and 174 individuals had at least 120 months of continuous follow-up from birth. The 60-month subgroup had a mean duration of follow-up of 8.1 years (2.80; 7.3 [6.0-9.4]) and the 120-month subgroup had a mean duration of follow-up of 12.7 years (2.44; 11.9 [10.6-14.2]) (Supplemental Table S2).
Population Demographic Characteristics
The study population was balanced between males (48.5%) and females (51.5%) (Table 2). The largest age categories were <1 year of age (26.2%) and 22-44 years (21.0%). Geographically, the population was concentrated in the South (31.3%). Race and ethnicity, available for approximately 75% of the population, included White (75.4%), Hispanic or Latino of any race (8.1%), Black or African American (6.9%), and Asian (6.2%). SES data were available for 89.5% of the study population. Most patients (>60%) were determined to be in the top 2 SES index quartiles (Table 2). Demographic characteristics for the 60-month and 120-month subgroups are displayed in Supplemental Table S2.
Population Clinical Characteristics
Nearly half of patients presented with congenital pulmonary valve stenosis, with ToF ranking second (Table 1). The 3 most common comorbidities were hypertension (16.8%), heart failure (15.4%), and asthma (14.9%) (Table 2). Further details about the prevalence of the CPVD diagnoses for each of the subgroups are shown in Supplemental Table S3. Arrhythmias, including ventricular arrhythmia (10.8%), atrial fibrillation (7.1%), and atrial tachycardia (6.8%) were prevalent (Table 2). Developmental delays were also common (15.3%). Among the 60-month and 120-month subgroups, the most common comorbidities were developmental delays (39.6% and 33.3%), asthma (26.6% and 31.6%), and heart failure (21.9% and 21.3%, respectively) (Supplemental Table S2).
Economic and Utilization Findings
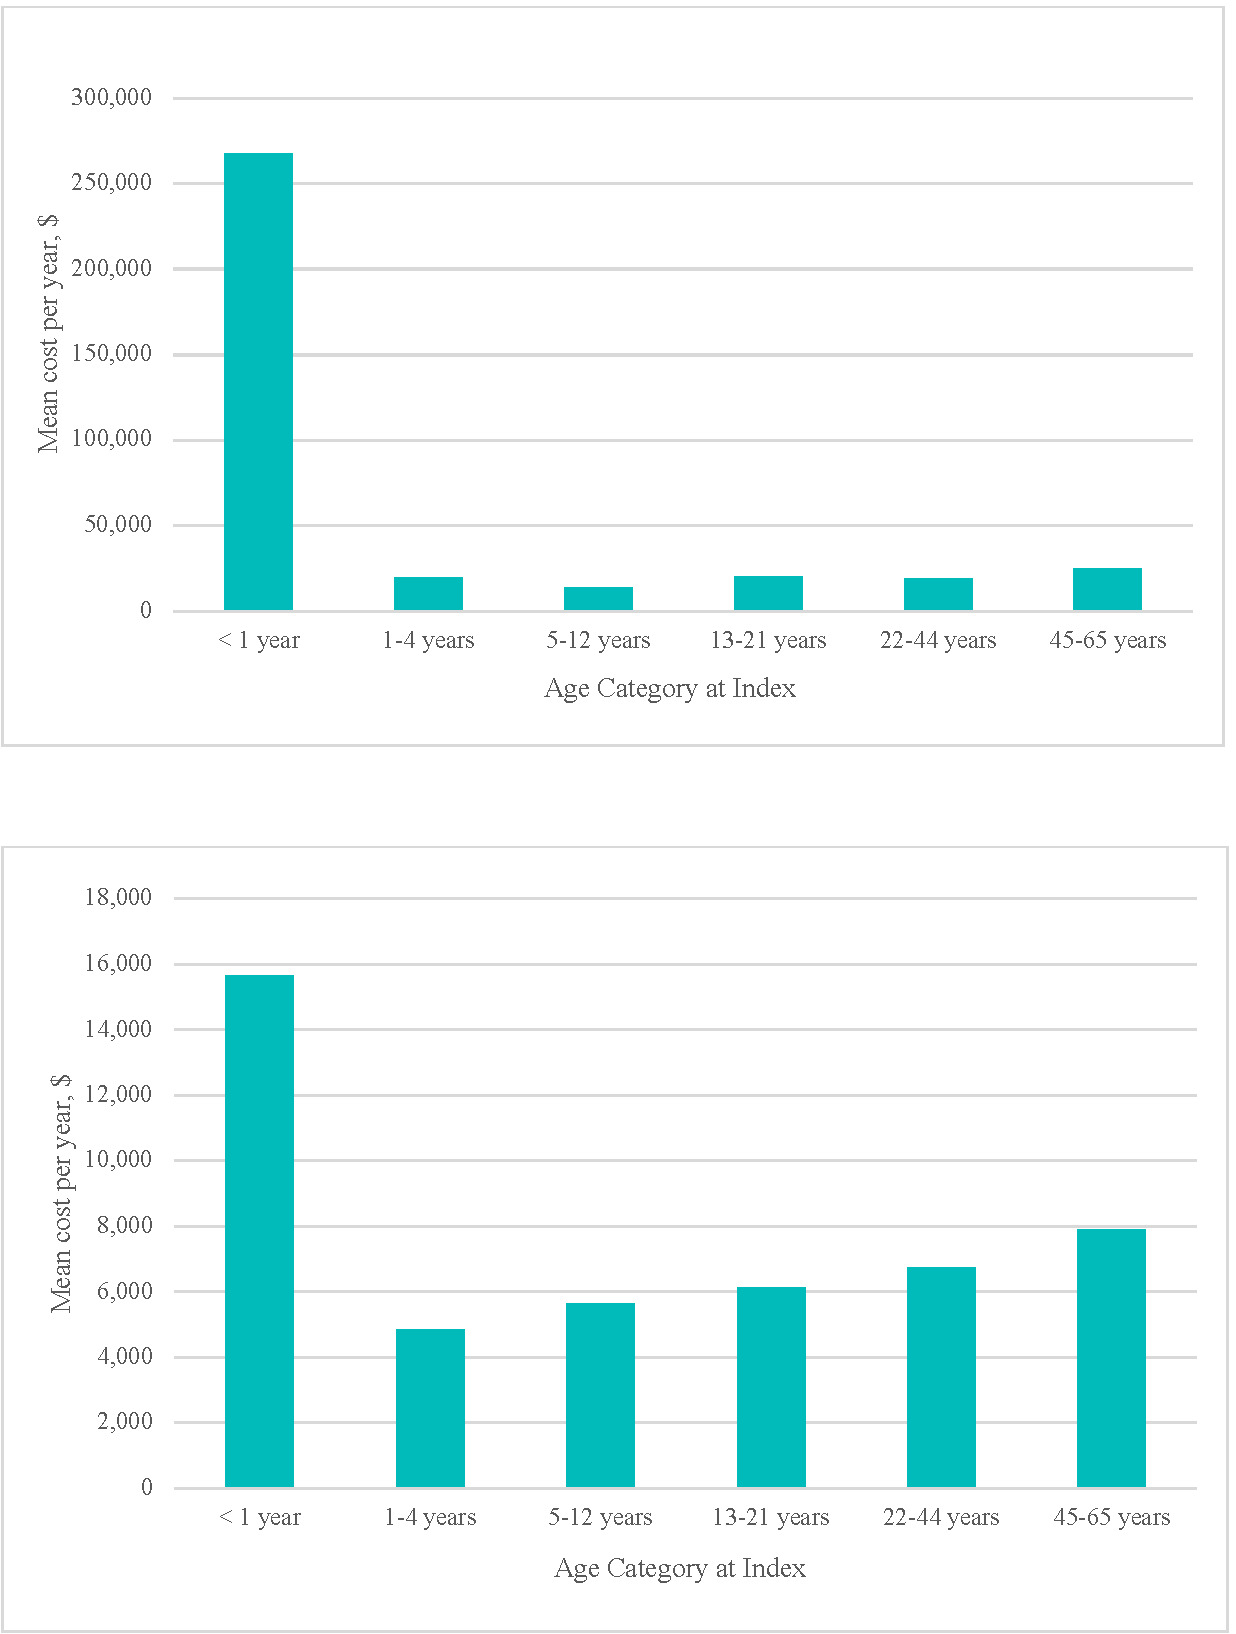
CPVD-related: CPVD-related inpatient admissions were present among 53.2% of patients under 1 year of age, with a mean (SD); median [IQR]) of 1.8 (5.89; 1.0 [0.0-2.0]) visits among all patients and 50.2 (74.21; 22.4 [10.0-60.0]) cumulative admission days among those with inpatient utilization. Heavy utilization (14.6%-34.0%) and lengthy admissions (>6 days) were observed among all ages (Table 3). Inpatient utilization frequency by diagnostic group was highest among patients with double outlet right ventricle, ToF, and pulmonary atresia, experienced by about 90% of the <1 year subgroup and over 97% of patients with those diagnoses in the 60-month follow-up subgroup (Supplemental Table S3). Inpatient utilization contributed the greatest proportion of total mean (SD; median [IQR]) annual costs for all age categories, ranging from $13 564 (127 445; 0 [0-0]) to $267 954 (737 565; 6,487 [0-238 486]) (Figure 1a, Table 3). Surgical interventions were conducted for 19.3% of CPVD patients <1 year, and 6.3% to 10.5% of all other age categories (Table 4). These patients incurred substantial mean inpatient costs (range $94 788 (181 583; 38 872 [17 183-81 097]) to $514 385 (926 572; 222 373 [114 107-530 671])) per hospitalization associated with lengthy hospital stays (range 5.7 (9.1; 5.0 [2.0-6.0]) to 24.6 (39.5; 10.0 [6.0-24.0]) days) (Table 4).
**_cpvd-related_mean_annual_inpatient_costs_by_age_at_index__**(b)**_cpvd-related_mea.png)
Outpatient service utilization, nearly universal during the first year of life (98.6%), remained high, averaging nearly 90% or higher for each age cohort (Table 3). Supplemental Table S4 provides a more detailed breakdown of outpatient components. Notably, patients <1 year had a mean (SD; median [IQR]) of 18.7 (32.1; 9.3 [4.0-22.5]) outpatient visits, including 8.1 (13.2; 4.9 [2.3-10.1]) office visits and 6.4 (15.3; 4.0 [2.0-7.8]) imaging encounters during their first year, while outpatient visits in the other age categories ranged between 5.4 (19.8; 2.7 [1.2-5.4]) and 9.6 (15.7; 4.8 [2.1-10.9]) (Supplemental Table S4). Outpatient costs, following the pattern of utilization, contributed a heavy annual financial burden for all age categories [mean (SD) range $4833 (13 039) to $15 637 (33 652)] (Figure 1b, Table 3). SD values were considerably higher than mean values for all cost and age categories indicating expensive outlier(s) within the data.
Sensitivity Analysis
CPVD-related inpatient utilization was common among the 60-month subgroup (60.6%) and 120-month subgroup (52.3%), with associated observed mean (SD; median [IQR]) costs of $52 993 (104 694; 9780 [0-55 945]) and $25 077 (63 096; 313 [0-19 019]), respectively. Outpatient service utilization was nearly universal among the 60-month subgroup (99.8%) and 120-month subgroup (99.4%). Associated annual outpatient costs were $6028 (11 917; 1742 [626-6482]) and $3301 (7923; 711 [302-2663]), respectively (Supplemental Table 5). Total observed cost per year was $59 537 (111 982; 13 690 [918-66 625]) and $28 893 (69 019; 2852 [400-23 858]), respectively.
All-cause utilization was prevalent among the 60-month and 120-month subgroups. All-cause mean (SD; median [IQR]) observed total costs were $72 846 (128 710; 20 085 [4,254-81 413]) for the 60-month subgroup and $41 390 (86 262; 8185 [2402-36 376]) for the 120-month subgroup (Supplemental Table S6).
Estimated Lifetime Cost Burden Projection
CPVD-related: Total CPVD-related mean (SD; median [IQR]) observed annual costs ranged from $19 844 (130 927; 1758 [516-6813]) to $284 276 (740 975; 34 541 [3800-263 674]), depending on age category (Table 3). Extrapolating the data, through age 21, the total mean CPVD-related projected cost was $788 188 and through age 65, $2 138 335 (Figure 2).
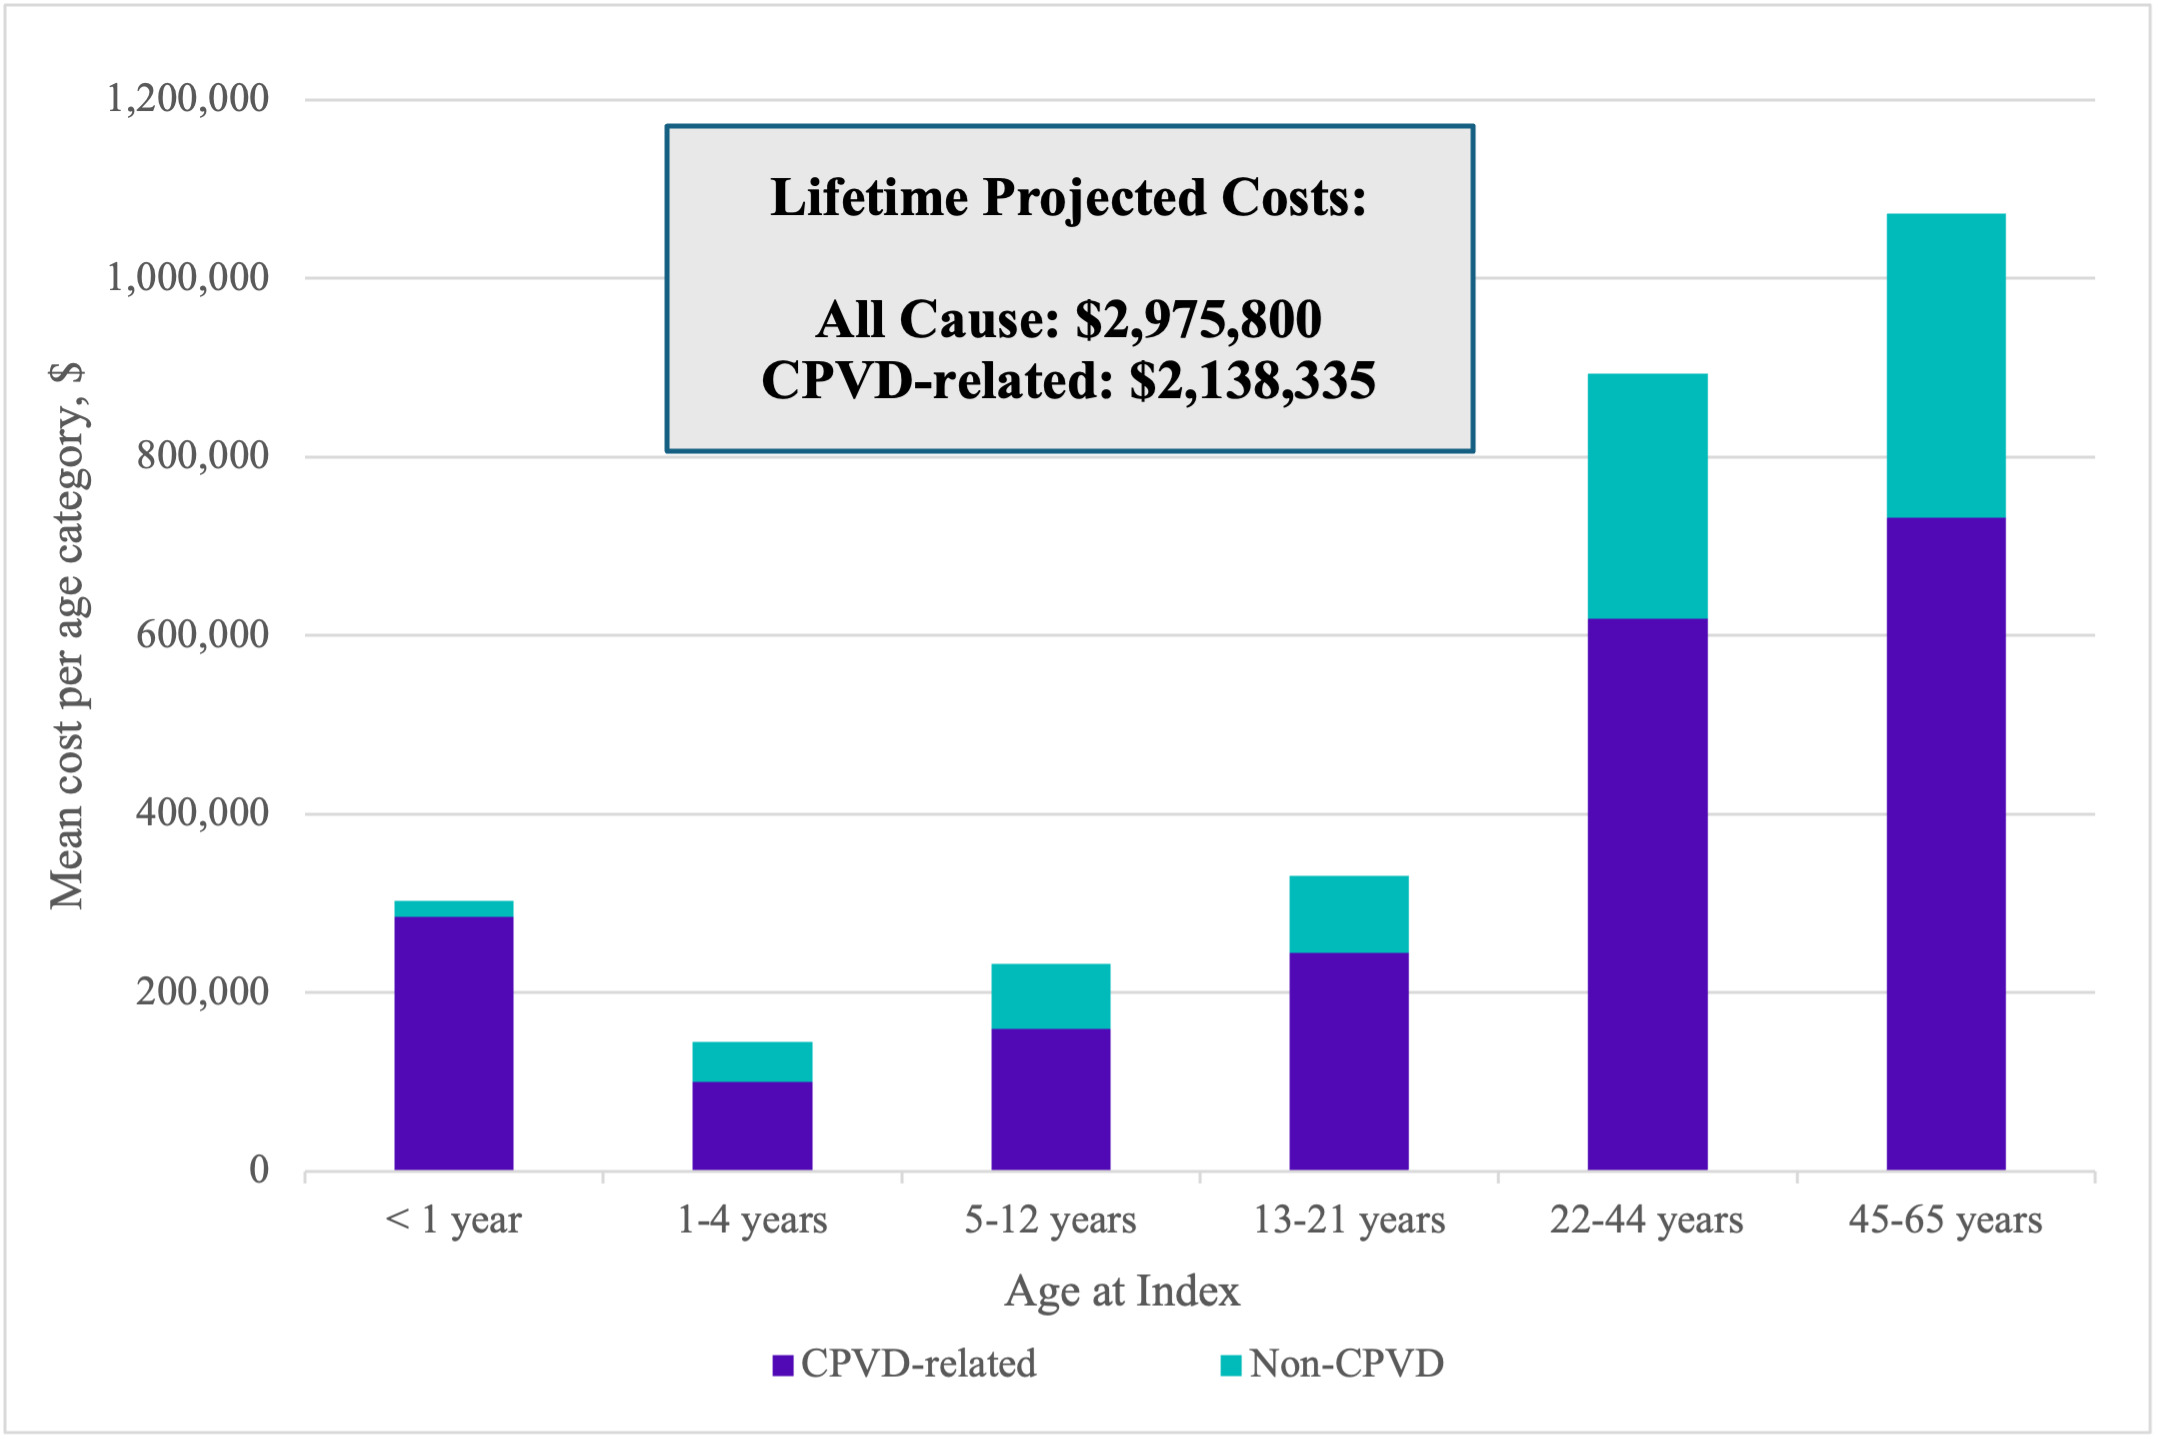
All-cause: All-cause mean (SD; median [IQR]) observed annual costs ranged from $29 002 (138 781; 5028 [1995-6538]) to $303 043 (747 650; 53 743 [9619-289 930]), depending on age category (Supplemental Table S7). Extrapolated all-cause projected costs across age cohorts totaled $2 975 800 through age 65. All-cause costs were mainly driven by CPVD-related expenses which accounted for 94% of total costs for the first year of life, and approximately 70% of total costs in other age categories (Figure 2).
DISCUSSION
Within a large, commercially insured population, this study demonstrates a substantial overall burden of illness and estimated financial cost for patients with CPVD. Patients and their families face a lifetime of CPVD-related challenges. Previously published estimates of CHD prevalence are derived from birth prevalence and survival statistics; the present study provides real-world evidence of prevalence, long-term costs, and burden of care for patients living with CPVD.3
CPVD patients and their families face numerous doctor visits, inpatient stays, outpatient hospital visits, and ED visits, which deleteriously impact quality of life by interrupting family, school, and occupational activities. Additionally, the burden of disease components of ongoing pain, discomfort, reduced exercise capacity, and fatigue warrant consideration.12 The childhood and projected lifetime financial burden noted in this study was substantial. Annual all-cause costs among adults in the study were $38 818 for ages 22 to 44 years and $51 055 for ages 45 to 65 years, with about 30% attributed to non-CPVD claims. For context, these values outpace the general annual all-cause healthcare expenditure of the adult US population aged 19 to 64, which ranged between $8313 and $9989 in 2020.30 It was beyond the scope of this study to determine the root cause of the high non-CPVD cost for this population. While non-CPVD costs play a role in overall projected lifetime healthcare costs, CPVD-related expense remains a major cost driver.
To address the gap in the present body of published literature about the long-term economic impact of CPVD, observed data in this rare condition were used to extrapolate lifetime costs. While this method may bias annualized cost estimates due to truncated observation windows, the average length of follow-up for study members was 3.5 years, providing the recommended medium to long-term interval of longitudinal data for such extrapolations.32 Additionally, the sensitivity analysis subgroups displayed a complete view of 60 months and 120 months of continuous observation from birth. The mean total annual all-cause costs for these subgroups were observed in the same range as the data collected for the age at index categories, supporting the plausibility of the projected lifetime cost result.
Almost half of the study population had congenital pulmonary stenosis and were likely to be managed with watchful waiting, while nearly 10% were diagnosed with pulmonary atresia, which typically requires immediate palliation and future reinterventions.13 ToF was highly prevalent within the study population and generally requires surgical intervention within the first few months of life. Improvements in surgical management of ToF have allowed over 98% of patients who survive their first year to survive into adulthood.11,33 However, post-CPVD repair pathologies, well established in the literature, frequently impact long-term health; hence, current efforts to advance treatment approaches are directed at preserving lifetime right-ventricular function.11,13,19,33–35 By finding substantial burden of illness, both in utilization and expenses, this study demonstrates that standard CPVD interventions continue to have significant limitations which are evident over a patient’s lifetime. Because CPVD patients incur an ongoing cost burden, decision makers should consider the impact of early interventions on long-term health outcomes and costs.
This study was subject to limitations. Administrative data, collected for billing and reimbursement purposes, may be subject to coding errors and omissions. For example, diagnosis codes may be included as rule-out criterion; however, at least 2 CPVD codes were required to reduce false positives. Providers may not prioritize coding an encounter for a congenital defect when treating a patient for conditions which are common sequelae of CPVD, especially in older individuals. In an attempt to capture appropriate CPVD-related utilization and costs, some of these conditions have been included as CPVD-related in the analysis. It is possible that these costs could be attributed to other non-CPVD cardiovascular comorbidities. Lifetime costs were estimated based on costs associated with each age band as projections and not as observed cost because no patient was tracked throughout their lifetime. Study results may not be generalizable to certain population segments: commercially insured individuals may have different characteristics than those who are uninsured or with other types of health insurance such as Medicaid.
CONCLUSION
Although significant research has improved our understanding of ongoing medical care required for patients with congenital pulmonary valve anomalies, this study retrospectively reveals the substantial financial burden and the treatment burden experienced by individuals with CPVD from infancy through adulthood. Surgical management of CPVD has improved, allowing survival into adulthood for most patients who survive their first year. However, substantial cardiovascular morbidity persists in many CPVD patients. Ongoing CPVD-related utilization and associated expenses demonstrate the need and potential for advances in care in this population.
Acknowledgments
Special thanks to Elizabeth A. Marks from Carelon Research for her significant medical writing contributions and Kayla Crocker for her data analytic support.
Disclosures
T.J.B., V.J.W., M.V., and K.W. are employees of Carelon Research, which received research funding from Autus Valve Technologies, Inc. for the study. T.J.B., V.J.W., and K.W. are stockholders of Elevance Health, the parent company of Carelon Research. E.A. reports consulting services to Autus Valve Technologies, Inc. S.C.H. is an employee, intellectual property holder, stockholder, and co-founder of Autus Valve Technologies, Inc.
Funding
Funding for this research was provided by Autus Valve Technologies, Inc.