
INTRODUCTION
Prostate cancer is one of the most common cancers in men worldwide and is the cause of 3.8% of all male cancer deaths.1 Screening for prostate cancer usually starts at age 50 years, and the average age at diagnosis is 67 years.2 For patients with low-risk cancer, active surveillance is a reasonable strategy to avoid treatment and the aligning side effects.3 However, for patients with progressed cancer warranting curative treatment intervention, radiation therapy and surgical prostatectomy are the most common approaches.4 Both interventions are associated with risk of urinary tract complications, which can have significant negative impacts on quality of life (QoL).5,6 For radiation treatment specifically, patients may experience either acute (within 90 days of treatment start) or late (>90 days from treatment start) genitourinary (GU) toxicity. While acute toxicity is usually temporary, late toxicity is associated with long-term damage, therefore causing long-lasting symptoms.7
The most utilized types of external beam radiation therapy for prostate cancer are stereotactic body radiation therapy (SBRT) and conventionally fractionated radiotherapy (CFRT). SBRT delivers high doses of radiation treatment in 5 or fewer fractions, resulting in a shorter, less expensive, patient-preferred treatment approach. By contrast, CFRT delivers between 35 and 44 low-dose fractions over a longer period.8 Both approaches have similar efficacy for improving prostate cancer cure and overall survival for prostate cancer patients.
While there is a slightly higher risk for toxicity with SBRT compared with CFRT, risk varies uniquely for each patient, and patients may be at high risk of toxic effects for one type of radiation but low risk for the other.9 There currently is no tool utilized for toxicity prediction with radiation therapies. Therefore, patient treatment pathways are assigned without knowledge of their personal toxicity risk profile. To combat this, MiraDx has developed PROSTOX™ ultra, an assay that analyzes a patient’s germline DNA to determine if the individual is at risk of late GU radiation toxicity based on treatment approach (ie, SBRT vs CFRT). The test provides a high or low risk score that can be used to assign the safest course of treatment to avoid toxicity. A recent validation study has confirmed the clinical utility of PROSTOX ultra to personalize radiation therapy.10
This analysis focuses on the value of personalized cancer treatment informed by PROSTOX ultra, which specifically tests patients for risk of late GU radiation toxicity from SBRT. PROSTOX ultra has a reported positive predictive value of 0.64 and a negative predictive value of 0.96 (sensitivity, 0.79; specificity, 0.92).9 Implementation of PROSTOX ultra is expected to enable the personalization of radiation, helping patients avoid toxicity from specific types of radiation therapy. In doing so, patients can experience fewer toxicity-related treatment costs and avoid QoL decrements associated with GU toxicity.
This study presents the methods and results of a lifetime cost-effectiveness analysis and a 5-year cost-impact analysis employed to capture the expected value to US payers of PROSTOX ultra utilization in prostate cancer patients. Results may help decision-makers evaluate the costs and benefits of accurately assessing the risk of late GU radiation toxicity from SBRT to guide treatment decisions. The goal of this analysis was to estimate the US payer-perspective cost savings and QoL improvements associated with reductions in late GU toxicity enabled by personalized radiation therapy approaches with PROSTOX ultra.
METHODS
Population
The analysis was conducted in Microsoft Excel. The modeled population consisted of patients with diagnosed prostate cancer who had been recommended for active treatment. It was assumed that no patients in this cohort were eligible for active surveillance or watchful waiting and that all patients would receive either SBRT, CFRT, or a prostatectomy.
Comparators and Outcomes
The analysis compared the 5-year cost impact and lifetime cost-effectiveness of PROSTOX ultra–guided treatment compared with standard-of-care (SOC) treatment recommendations. The 5-year incremental costs provided insight into the expected short-term economic impacts that PROSTOX ultra may have. Meanwhile, the lifetime analysis produced incremental costs, incremental quality-adjusted life-years (QALYs), and an incremental cost-effectiveness ratio (ICER) to compare the long-term cost and clinical outcomes between PROSTOX ultra and SOC.
A QALY captures patient QoL and life expectancy into a single measure, representing the total value of health outcomes. A QALY is calculated by multiplying total expected years of life by the average corresponding QoL, measured as a utility value on a scale from 0 (death) to 1 (perfect health). An ICER estimates the economic value of an intervention compared with standard care, using the QALY as the measure of clinical effectiveness. An ICER is calculated as the difference in costs divided by the difference in QALYs between two interventions, generating a cost per QALY. This outcome represents the amount that one would expect to pay with the new intervention to gain 1 year of perfect health.
Model Framework
The model framework consisted of two interconnected structures. A decision tree was used to capture the first stage of the clinical story, depicting the patient treatment decision pathway. This fed directly into a lifetime Markov simulation, which modeled the clinical and economic toxicity-driven outcomes of each treatment pathway. Discounting was not applied in the model as it was assumed that the rate of inflation would equal the discount rate over the relevant period.
Decision tree: Figure 1 displays the decision pathway for patients with treatment guided by PROSTOX ultra results compared with patients not utilizing PROSTOX ultra (SOC). With SOC, patients either proceeded to receive SBRT, CFRT, or prostatectomy as estimated by general population utilization estimates from the literature. Patients utilizing PROSTOX ultra–guided treatment were stratified as high risk or low risk for late GU toxicity from SBRT. This risk assessment impacted the resulting treatment strategy, with fewer high-risk patients receiving SBRT and more patients receiving SBRT when considered low risk.
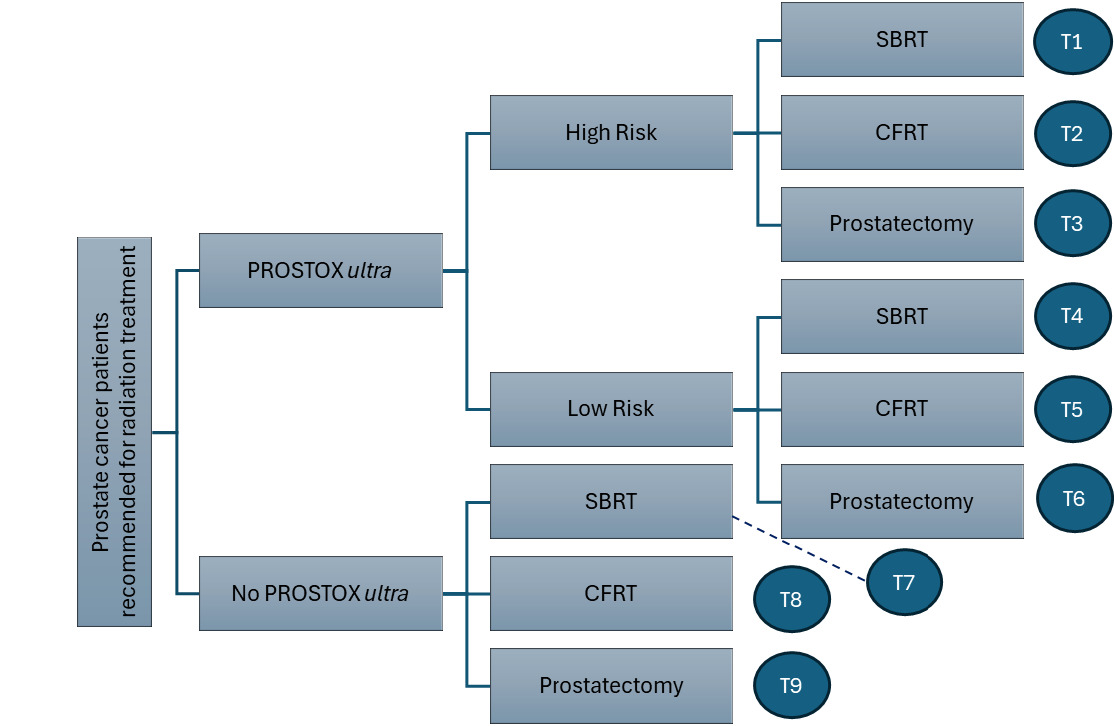
Each arm of the decision tree is shown alongside a labeled end node, indicating the treatment “track” that patients on that pathway experience. Each of the 9 tracks was associated with unique costs, QoL values, and transition probabilities within the ensuing Markov model.
Markov model: Each track’s population fed into a unique Markov model that followed patient toxicity-related outcomes through their lifetime. Each of the Markov models shared an identical model structure but were populated with individual input parameters depending on the population track, which varied the time spent in each disease state and resulting costs and clinical outcomes.
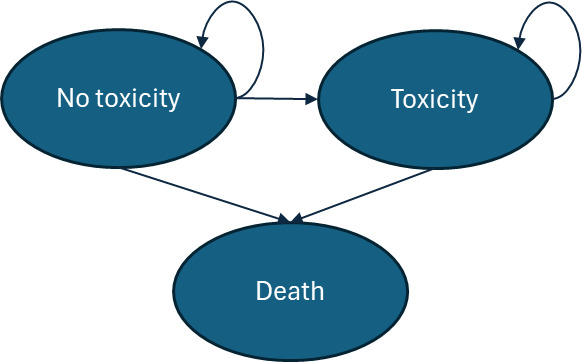
Each Markov simulation consisted of three distinct disease states: no-toxicity, toxicity, and death (Figure 2). It was assumed that the entire patient population, regardless of track, started the Markov model at age 67 years (the average age of prostate cancer diagnosis in the United States).11 Each cycle length was 1 year, and the model continued through the cohort’s lifetime, ending after all patients have moved into the death state. In each track simulation, 10 000 patients were entered into the model. The simulation was assumed to begin at the threshold of the “late toxicity” definition, 90 days after radiotherapy (or surgery) completion. All patients therefore entered the model (T0) in the “no-toxicity” state. In cycle 1, patients can move into the “toxicity” disease state, which represents the probability of late toxicity development in the first year after toxicity would meet the “late” toxicity definition. Once a patient moves into the late-toxicity disease state, it was assumed that they will experience the aligning management costs and QoL decrements through the remainder of their life. The death state was assumed to be absorbing (meaning that patients cannot exit this disease state once entering).

It is important to recognize that prostatectomy does not result in what one would consider “toxicity,” as this term generally encompasses effects specific to radiation therapy. However, this model captured the GU side effects of prostatectomy under the “toxicity” definition, as there was significant overlap between the symptoms of radiation-driven toxicity and surgery-caused GU complications. For instance, both treatments can cause symptoms such as urinary frequency, urinary urgency, and incontinence.12 For this reason, patients on a surgical track still entered a Markov model with toxicity and no-toxicity disease states.
Clinical inputs: All clinical parameters were extracted from targeted literature searches. Decision tree and Markov model–specific inputs are displayed alongside references in Table 1. Where assumptions or calculations were utilized, the references column of the table provides a footnote describing the input’s justification. While the impact that PROSTOX ultra would have on clinical practice is still being defined, the current model assumed that 100% of patients receiving radiation therapy with PROSTOX ultra results would adhere to the radiation modality recommended for their risk outcome. Therefore, no patients receiving a high-risk PROSTOX ultra result would receive SBRT, while no patients receiving a low-risk PROSTOX ultra result would receive CFRT. The 100% adherence did not apply to patients who would have undergone prostatectomy with SOC. Instead, among the patients who received PROSTOX ultra and were low risk, we assumed that, over time, the utilization of prostatectomy would be reduced from about 49% with SOC to about 10%. This represented an 80% decrease in utilization compared with SOC, as most patients were expected to utilize SBRT in place of surgery if not deemed at high risk for radiation toxicity.13
All toxicity rates shown in Table 1 represented the probability of GU toxicity development in the first cycle of the model. For all SBRT and CFRT tracks, this transition probability was maintained until cycle 5, where a toxicity development taper took effect. For all prostatectomy tracks (tracks 3, 6, and 9), patients can only move into the toxicity state in the first cycle of the model. No toxicity development was modeled for this population thereafter, although the model assumed patients remained in the toxicity state until death. Annual toxicity probabilities for each track and calculations are shown in Supplementary Table S1.
Economic inputs: All cost parameters are displayed in Table 1 alongside references from targeted literature searches. Economic values were inflated to 2024 US dollars using the Bureau of Labor Statistics Consumer Price Index for medical care as needed.25
Uncertainty analyses: A one-way deterministic sensitivity analysis (DSA) was conducted to assess the impact of independent variations to input parameters on the overall 5-year cost-impact results. This analysis varied each model parameter by 20% in either direction, estimating results at the 20% high value and the 20% low value. For the lifetime cost-effectiveness model, a probabilistic sensitivity analysis (PSA) was performed to account for uncertainty in model inputs (Supplementary Table S2). The PSA consisted of 10 000 model simulations in which each variable was randomly varied along its appropriate distribution curve. Generally, cost inputs were varied along a gamma distribution while probabilities and utilities were varied along a beta distribution. Where error data were not available, a 10% standard error from the mean value was assumed.
RESULTS
The decision tree model resulted in 9.5% of the PROSTOX ultra population in track 2 (high-risk CFRT), 9.2% in track 3 (high-risk prostatectomy), 73.3% in track 4 (low-risk SBRT), and 8.0% in track 6 (low-risk prostatectomy). No patients followed tracks 1 or 5 (high-risk SBRT, low-risk CFRT). In the SOC arm, 38.3% of patients were in track 7 (SBRT), 12.4% in track 8 (CFRT), and 49.4% in track 9 (prostatectomy). These distributions equate to 73.3% of the total PROSTOX ultra population receiving SBRT, 9.5% receiving CFRT, and 17.3% undergoing prostatectomy, compared with 38.3% of SOC patients receiving SBRT, 12.4% receiving CFRT, and 49.4% undergoing prostatectomy.
The annual per-patient costs and QALY outcomes for each track are shown in Table 2 alongside the track weight, which represents the percentage of each arm’s population entering each track of the model. Treatment costs were assumed to be accumulated at the start of the Markov model and were therefore presented separately from the annual clinical costs. The presented annual costs were specific to each population track; for instance, 38.30% of SOC patients experienced the per-patient annual costs (shown in Table 2 for the first 5 years of the model) and aligning lifetime costs and QALYs listed for track 7 (SOC SBRT).
Five-Year Cost Impact
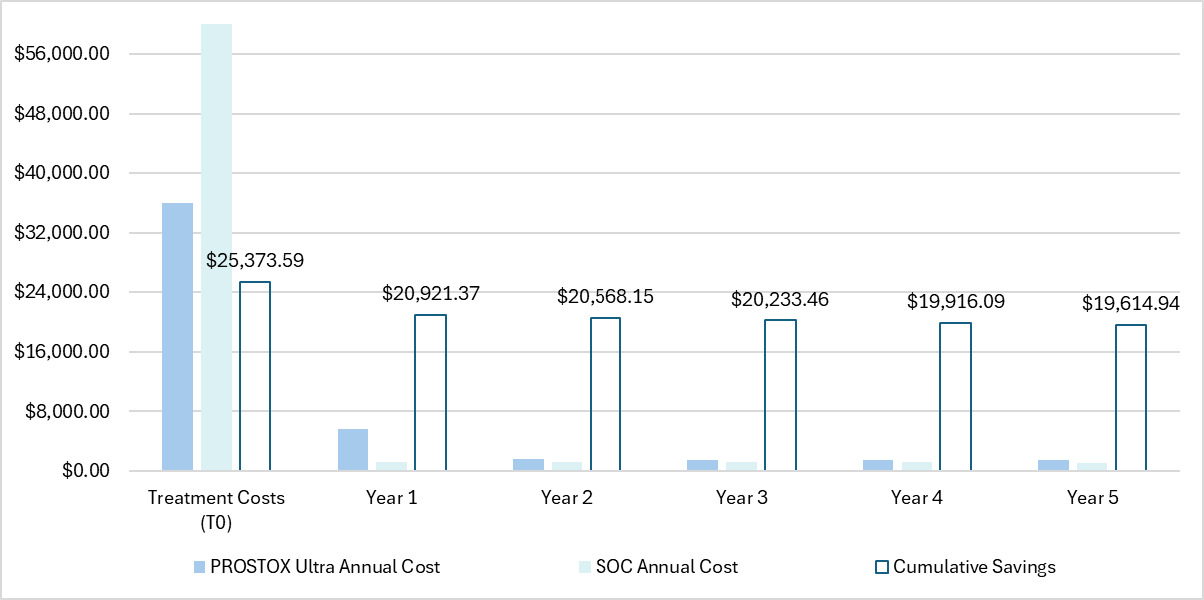
Cost-impact results were estimated by weighting each track’s corresponding costs by the percentage of the population in each arm. For instance, Table 2 shows year 5 costs for SOC patients to be $1085 for patients in track 7 (SBRT; 38.30% of SOC patients), $339 for patients in track 8 (CFRT; 12.35% of SOC patients), and $1320 for patients in track 9 (prostatectomy; 49.35% of SOC patients). The year 5 costs for SOC patients were therefore calculated as the sum-product of the costs and the percentage of the SOC population in each arm ($1109). Using the same approach for each year (including T0) and summing across all annual totals yielded the cumulative 5-year costs.
The resulting annual costs and cumulative savings through a 5-year period are depicted for each arm in Figure 3. Over 5 years, patients using PROSTOX ultra totaled $47 683 in costs, compared with costs of $67 298 with SOC. Cumulative savings over 5 years were therefore estimated to be $19 615 per tested patient. When running the model at various costs for PROSTOX ultra, positive savings were still seen even if priced over $10 000.

According to the DSA, the variable with the greatest impact on 5-year cost savings was the percentage of patients in SOC receiving prostatectomy, followed closely in scale by the cost of the prostatectomy (Supplementary Figure S1). This is logical given the high cost of surgery. Similarly influential parameters were the percentage of SOC surgical patients who would instead use SBRT with a low-risk PROSTOX ultra result and the adherence to the PROSTOX ultra result for SOC radiation patients. As these are the model assumptions most likely to vary unpredictably in the real-world setting, it is significant that savings remained prominent with changes to these values. Most importantly, this analysis confirms that the savings generated in the cost-impact model remain robust to variations in all modeled input parameters.
Lifetime Cost-Effectiveness Analysis
In the cost-effectiveness analysis, there was a noticeable differential in total cohort QALYs (11.63 vs 11.39), which was likely driven by the increased utility values for patients in PROSTOX ultra track 4 (low-risk patients using SBRT, who have a reduced risk of toxicity compared with SOC patients). There was no life-year difference between the two arms, as the model did not model an effect on mortality. PROSTOX ultra had lower lifetime costs compared with SOC ($82 337 vs $107 114), thus indicating a dominant strategy (incremental cost-effectiveness ratio) with QALY gains of 0.24 and cost savings of $24 777.
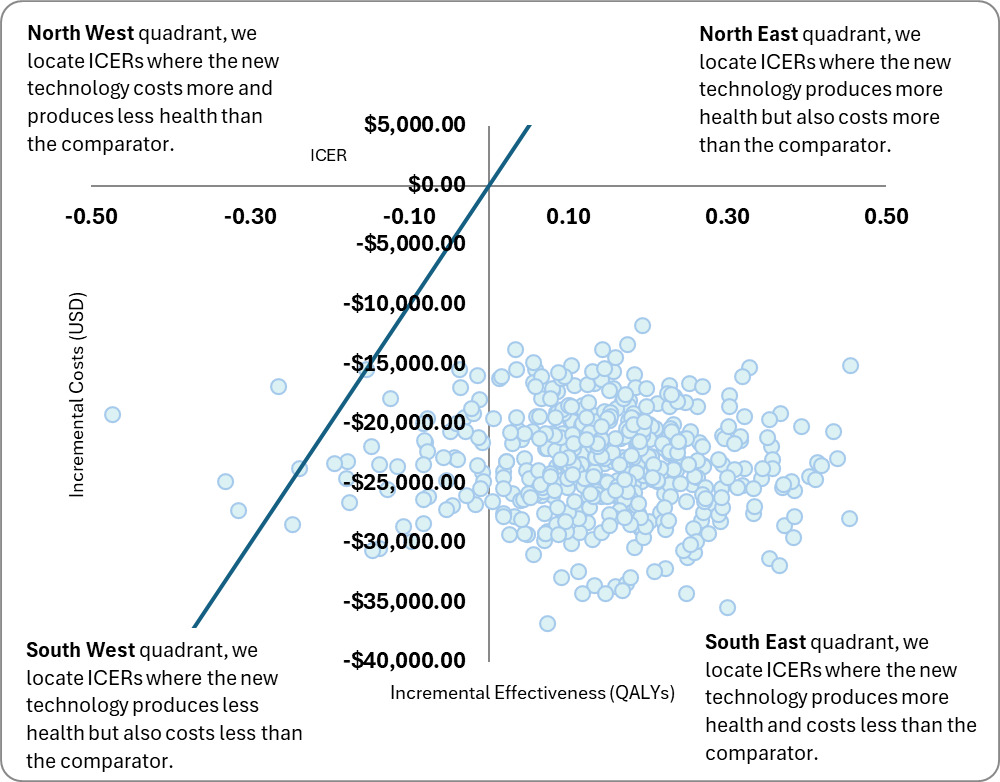
A scatterplot of the outcomes of each simulation run of the PSA is shown in Figure 4. A trendline representing the standard willingness-to-pay threshold in the United States ($100 000 per QALY) was plotted for reference. Nearly all the simulation datapoints fall below this threshold line and are thus considered cost-effective. Most of the simulation ICERs fall into the southeast quadrant of the cost-effectiveness plane, which depicts a dominant strategy. Plotting of cost-effectiveness acceptability curve (Supplementary Figure S2) for PROSTOX ultra and SOC showed that PROSTOX ultra would be cost-effective at any willingness-to-pay threshold through $150 000, which is logical as it is a dominant strategy compared with SOC.

DISCUSSION
This analysis emphasized the economic benefits of adapting PROSTOX ultra as a prediction tool for risk of late GU toxicity with SBRT in patients with prostate cancer. Utilizing PROSTOX ultra in place of the current SOC decision-making process, which does not include a risk-ranking tool, was expected to save $19 615 per tested patient over a 5-year period. PROSTOX ultra was also expected to reduce overall lifetime costs and increase QoL compared with SOC.
The value of PROSTOX ultra stems first from allocating proper radiation technology to each patient according to their toxicity risk. As supported by a study conducted to assess whether PROSTOX ultra would influence treatment choice, patients at high risk of toxicity from SBRT would utilize CFRT in its place, resulting in a decreased comparative risk of toxicity, while patients with a low risk of toxicity with SBRT would logically utilize SBRT.26 Further, patients with a low risk score may be encouraged to utilize SBRT radiation therapy instead of proceeding with a prostatectomy, given the low risk of toxicity-related side effects.13 The value identified in this analysis is expected to persist when considering utilization of moderately hypofractionated radiation therapy vs CFRT as well, as toxicity outcomes are similar between these two therapies.27
This evidence is especially relevant for clinicians making treatment decisions for patients with prostate cancer, as both improvements in patient QoL and reductions in payer costs are presented. Recent studies have shown the utilization of short-form radiation therapy rising over time, implying that the results of this SBRT study may become increasingly relevant in future years.28
As PROSTOX ultra is, to our knowledge, the first risk-ranking predictive tool for radiation therapy in the prostate cancer space, direct comparison to existing economic analyses was not possible. However, evidence has been recently published assessing the cost-effectiveness of gene expression profiling tests for breast cancer relapse risk to guide the utilization of endocrine therapy and adjuvant chemotherapy. A 2025 analysis of the Prosigna assay in Norway identified a non-cost-effective ICER of €255 622 compared with standard immunohistochemical markers but showed cost-effectiveness in a population restricted to patients assessed as uncertain chemotherapy candidates (ICER, €8884).29
This study has three important limitations. First, the analysis was a cohort-driven model that represents the average patient with prostate cancer and did not reflect specific subgroups or unique cases. However, because PROSTOX ultra is based not on tumor analysis, but on inherited genes, subgroups and unique cases would not be expected to alter the conclusions. Second, most of the cost and utilization parameters were literature based and were therefore subject to heterogeneity in the respective populations. Finally, the model was driven by assumptions on PROSTOX ultra treatment adherence and influence. While the expected impact of PROSTOX ultra was supported by evidence of its prediction accuracy, the actual clinical impacts were unknown as the adherence to PROSTOX ultra’s outcomes is evolving. A current unpublished clinical study estimates 80% compliance to alternative treatment instead of SBRT with a high-risk PROSTOX ultra result, and trust in the tool’s risk ranking is expected to rise over time, increasing adherence to test results as clinician confidence continues to grow.
CONCLUSIONS
Utilization of PROSTOX ultra to determine risk of late GU radiation toxicity from SBRT was expected to generate short-term cost savings due to reductions in toxicity development and fewer costly prostatectomies. The implementation of PROSTOX ultra was estimated to save $19 615 per tested patient over a 5-year period. The analysis also supported the cost-effectiveness of PROSTOX ultra compared with SOC, predicting an increase in QALYs and reductions in costs over a lifetime.
Disclosures
J.T.C. is an employee of Avalon Health Economics, where J.E.S. is the CEO and principal. Avalon Health Economics was compensated for the completion of this work.
Funding
Funding for this study was provided by MiraDx to Avalon Health Economics. The publication of study results was not contingent on the sponsor’s approval or censorship of the manuscript.