

BACKGROUND
The US Centers for Disease Control and Prevention estimates that over 38 million Americans (approximately 1 in 10) have diabetes, with type 2 diabetes accounting for 90% to 95% of cases. About 1.2 million Americans aged 18 years or older were diagnosed with type 2 diabetes in 2021.1 The total estimated cost of diagnosed diabetes in the United States in 2022 was $412.9 billion, which included $306.6 billion in direct medical costs.2
Many factors can contribute to an increased risk of falls. Impaired balance and gait, polypharmacy, and history of previous falls have been identified as major risk factors; other risk factors include age, female gender, visual impairments, cognitive decline, reduction in lower extremity strength, cardiovascular disease, certain medications, depression, and environmental factors.3 Furthermore, results of a retrospective study of the National Health Interview Service database have revealed the importance of incorporating social determinants of health into fall risk assessments.4 Hypoglycemia has been associated with an increased risk of falls, both in community5 and hospital settings.6,7 The US Department of Health and Human Services identifies hypoglycemia as among the top 3 priorities for preventable adverse drug events.8 Older adults are at increased risk of hypoglycemia because of multiple comorbidities, attenuated counterregulatory mechanisms, polypharmacy, and hypoglycemia unawareness.9
Studies in people with type 2 diabetes have shown an association between hypoglycemia and fall-related fractures,10–12 along with other serious adverse events and mortality.13 The likelihood of falls is increased in those receiving insulin therapy, which itself is associated with an increased risk of hypoglycemia.14 A US public health surveillance study showed that older adults who received insulin were more than twice as likely as younger adults to visit the emergency department (ED) and nearly 5 times as likely to be hospitalized for insulin-related hypoglycemia.15
The most recent basal insulin analogs—insulin glargine 300 U/mL (Gla-300) and insulin degludec 100 and 200 U/mL (IDeg)—are termed longer-acting (second-generation) treatments because they have longer durations of action (>24 hours, and less variability) than the long-acting (first-generation) insulin glargine 100 U/mL (Gla-100).16
Data from randomized controlled trials demonstrate that Gla-300 has a lower hypoglycemia risk than intermediate-acting neutral protamine Hagedorn (NPH) insulin17,18 or the long-acting basal insulin analogs (Gla-100 and insulin detemir [IDet] 100 U/mL),19–24 with these findings being corroborated in real-world studies.25–29 The treat-to-target trial BEGIN Once Long30 compared treatment with IDeg-100 and Gla-100 in insulin-naive individuals with type 2 diabetes and revealed similar glycemic control and overall rates of confirmed hypoglycemia for IDeg and Gla-100, and fewer episodes of nocturnal confirmed hypoglycemia with IDeg. However, the association between hypoglycemia and risk of fall or fall-related fracture (fall/fracture) for longer-acting vs long-acting basal insulins/NPH has not been investigated. Results of the BRIGHT study31 (a head-to-head randomized controlled trial comparing Gla-300 and IDeg-100 insulin-naive patients with uncontrolled type 2 diabetes) revealed similar improvement in glycemic control and similar rates and incidence of hypoglycemia for Gla-300 and IDeg, with the exception of lower rates with Gla-300 in the titration period. Therefore, we used Gla-300 to represent the class of longer-acting basal insulin analogs.
This real-world, retrospective study evaluated fall/fracture-related healthcare resource utilization (HCRU) and costs in people with type 2 diabetes aged 50 years and older treated with longer-acting Gla-300 vs long-acting basal insulins (Gla-100/IDet 100 U/mL) or NPH insulin and also the association between fall/fracture events and hypoglycemia. As many organizations32–35 define older adults as those 65 years and older, the analysis was also conducted in the 65 years and older subgroup (see Supplementary Online Material).
METHODS
Data Source
This study used secondary data from administrative claims in the Optum de-identified Clinformatics® Data Mart Database, which spans more than a decade and provides eligibility and enrollment information on over 77 million commercially insured and Medicare Advantage members in all 50 states.36
Inclusion and Exclusion Criteria
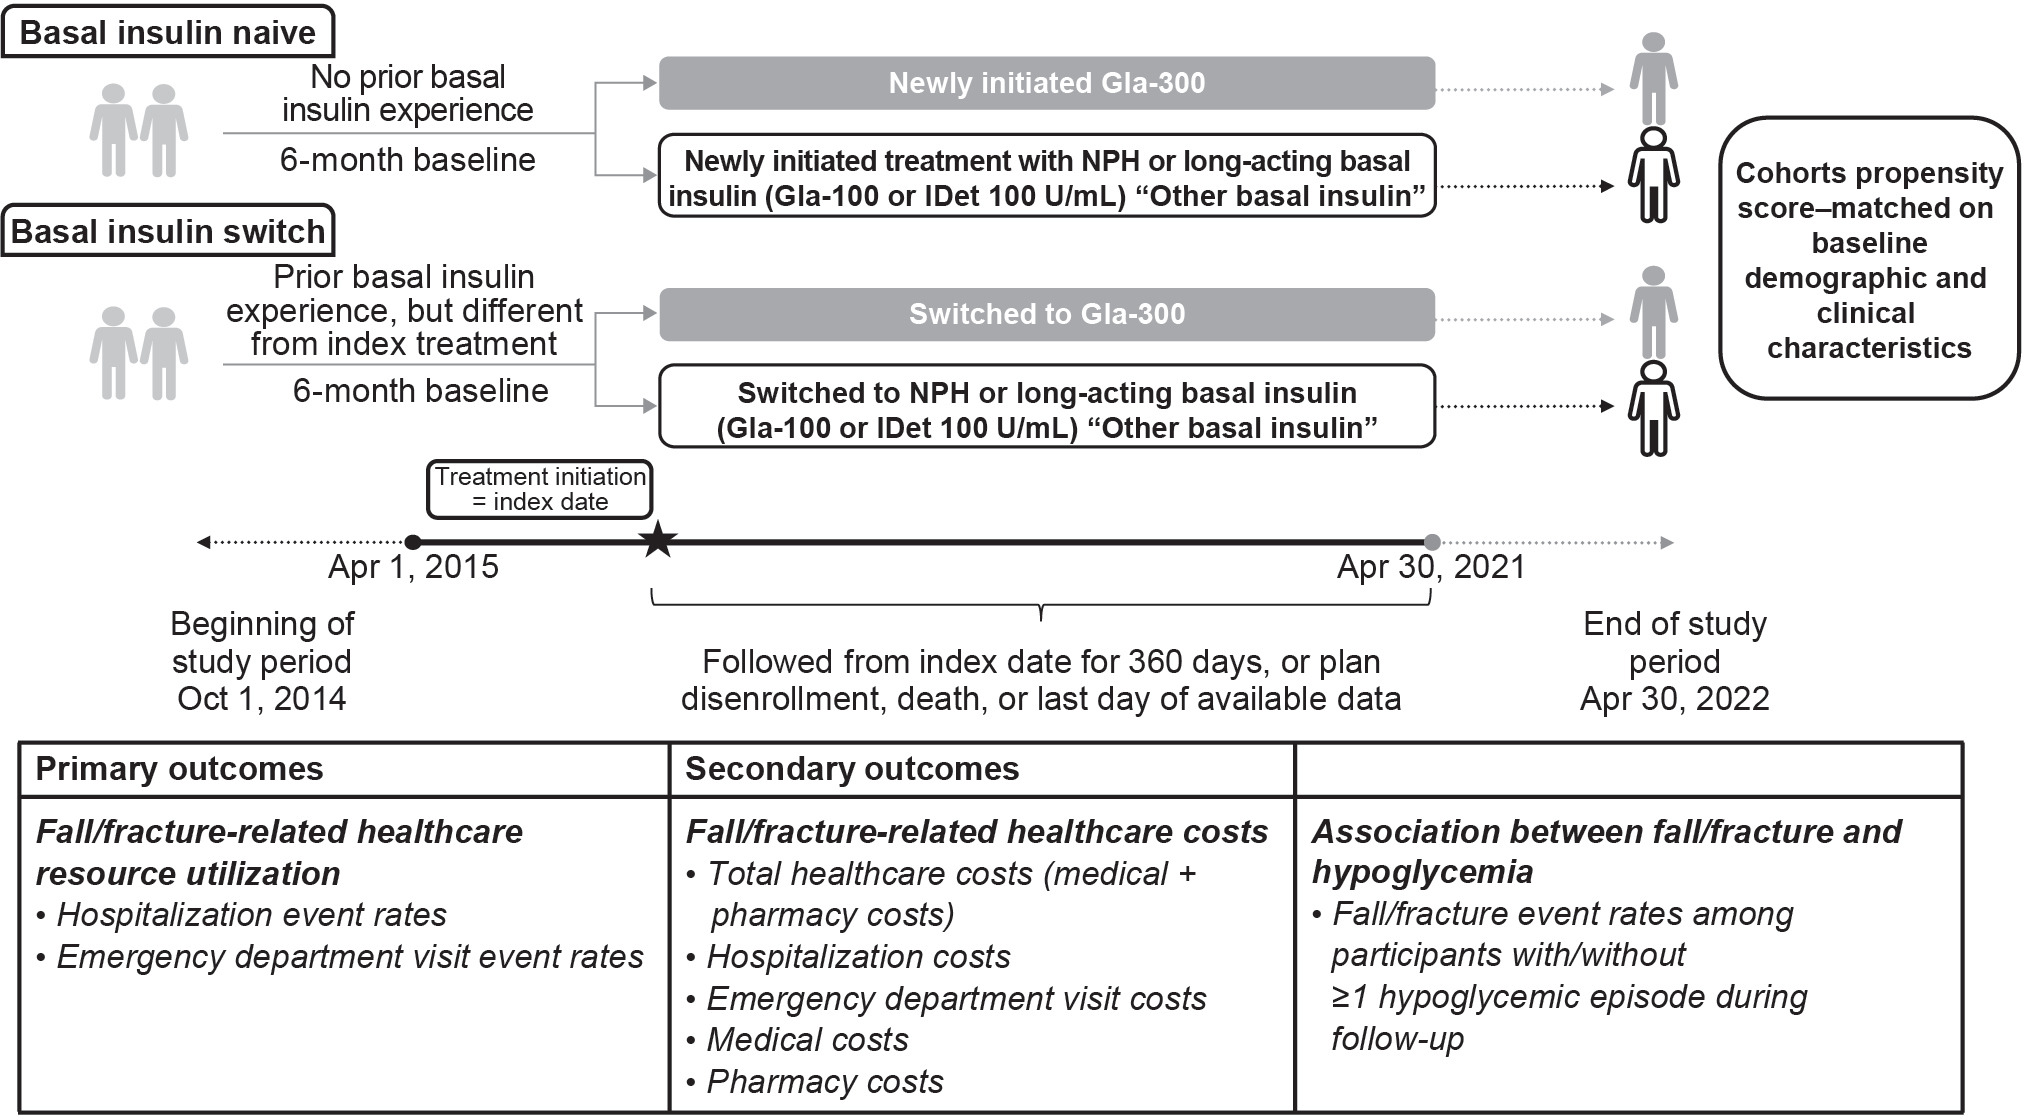
The cohort comprised people with a diagnosis of type 2 diabetes according to the International Classification of Diseases (ICD)-9 or ICD-10 who were aged 50 years and older and had at least 1 prescription claim for basal insulin (excluding insulin degludec [IDeg]) between April 1, 2015, and April 30, 2021 (Figure 1). Individuals with a diagnosis of other/type 1 diabetes at any time during the study period, those who had prescription claims for multiple basal insulins on the same day, and those who had prescription claims for IDeg during the study period were excluded. Participants were required to have at least 6 months of continuous enrollment prior to the basal insulin prescription fill. Follow-up ranged from 1 to 360 days.

Study Groups and Exposure
Assessments were performed for both people with type 2 diabetes with no prior basal insulin use (basal insulin–naive cohort) and people who switched basal insulin from a different index basal insulin (basal insulin–switch cohort). Participants in the basal insulin–naive cohort had no previous basal insulin exposure in the 6 months (180 days) prior to baseline and newly initiated treatment with Gla-300, Gla-100, IDet, or NPH. Participants in the basal insulin–switch cohort had previously received Gla-100, IDet, or NPH and switched to either Gla-300 or a basal insulin different from their index basal insulin.
The basal insulin–switch cohort was identified using a hierarchical approach in which the first claim for Gla-300 was identified and participants were classified as switch users if they had a claim for a basal insulin other than Gla-300 during their baseline period. After these individuals were removed from the pool, the same process was repeated for Gla-100, IDet, and NPH, in that order. For each participant, only the first switch was considered. The primary analysis was conducted in the overall population aged 50 years and older.
Identification of Falls/Fractures and Hypoglycemia
Falls/fractures were identified according to ICD-9-Clinical Modification (CM), ICD-9-Procedure Code Sets (PCS), ICD-10-CM, Current Procedural Terminology (CPT), and Healthcare Common Procedure Coding System (HCPCS) codes. Hypoglycemia was identified using either ICD-9-CM and ICD-10-CM codes, or a laboratory-confirmed fasting or non-fasting plasma glucose value of less than 70 mg/dL. Full details of codes are presented in Table 1.
Propensity Score Matching
Cohorts were 1:1 propensity score–matched according to baseline demographic and clinical characteristics using a greedy nearest-neighbor matching algorithm and a caliper of 0.2 SD of the logit of the propensity score. Once a match was made, participants were not reconsidered. A standardized mean difference less than 0.1 indicated balance between groups with any remaining imbalanced characteristics accounted for by inclusion as covariates in outcome models.
The following demographic and baseline characteristics (determined by ICD-9 or ICD-10 codes) were considered to be associated with risk of fall/fracture and were included in the propensity score–matching (PSM) model: age, gender, healthcare plan type, region, baseline comorbidities/complications, baseline use of oral or injectable antidiabetic agents, diabetes polypharmacy (intake of ≥3 different noninsulin antidiabetic agents within 30 days of index date), history of hypoglycemia, history of falls/fractures, frailty and age-related factors (vision loss and impairment, cognitive impairment and dementia, age-related physical debility, osteoarthritis, osteoporosis), medications (antipsychotics, antidepressants, benzodiazepines, polypharmacy), high-risk triggering events and conditions (hypotension/postural hypotension, vertigo, syncope and collapse, nonepileptic seizure, malaise, fatigue), and baseline glycated hemoglobin A1C. Demographic and baseline characteristics before and after PSM are detailed in Table 2.
After matching, baseline characteristics were considered balanced between cohorts, with any imbalances that persisted after PSM included as covariates in analysis models. Baseline sulfonylurea use, HCRU, and history of falls and hypoglycemia were similar between treatment groups for both age groups and for both the basal insulin–naive and basal insulin–switch cohorts. The basal insulin–naive model (n = 14 533/group) was adjusted for region and number of oral antidiabetic drugs, while the basal insulin–switch model (n = 8893/group) was adjusted for healthcare plan type.
Study Outcomes
The primary outcome was HCRU (hospitalizations and ED visits) related to falls or fractures. Secondary outcomes were investigation of the crude association between fall/fracture events and hypoglycemia (assessed by fall/fracture event rates among participants with vs without at least 1 hypoglycemic episode during follow-up) as well as assessment of fall/fracture-related paid costs (hospitalization, ED visit, and total health care [all medical and pharmacy costs]). Medical costs included outpatient, inpatient, ED, laboratory, imaging, and other costs, excluding pharmacy costs.
Data Analysis
Results were reported as 95% confidence intervals for rate and other ratios; P values and statistical inference were not reported.
RESULTS
Demographic and Baseline Characteristics
Between April 1, 2015, and April 30, 2021, 95 564 and 838 996 people with type 2 diabetes were identified with at least 1 prescription claim(s) for Gla-300 or long-acting basal insulins/NPH, respectively. For the basal insulin–naive cohort, 14 534 participants who received Gla-300 and 137 332 who received long-acting basal insulins/NPH were included in the analysis. The basal insulin–switch cohort consisted of 10 066 participants who received Gla-300 and 13 608 who received long-acting basal insulins/NPH (Supplementary Table S1).
Primary Outcome: Fall/Fracture-Related HCRU
For the primary outcome in the basal insulin–naive cohort, following PSM, both fall/fracture-related hospitalization (2.88 vs 3.33 events per 100 person-years of follow-up [P100PYFU]) and ED visit event rates (5.28 vs 5.95 events P100PYFU) were numerically lower in people who initiated Gla-300 vs long-acting basal insulins/NPH. Results were similar in the basal insulin–switch cohort, with those who switched to Gla-300 having numerically lower hospitalizations (2.54 vs 3.38 events) and ED visits (4.48 vs 5.21 events; Figure 2).

Association Between Falls/Fractures and Hypoglycemia
The results of this retrospective study suggest a positive association between falls/fractures and the incidence of hypoglycemia. Fall/fracture event rates were numerically higher for people with vs without hypoglycemia, regardless of whether participants were newly initiating basal insulin or switching basal insulin (Figure 3). There were numerically fewer falls/fractures in people who received Gla-300 vs long-acting basal insulins/NPH across all comparisons, with the difference being particularly notable in the basal insulin–switch cohort.

Fall/Fracture-Related Healthcare Paid Costs
In the basal insulin–naive cohort, fall/fracture-related total healthcare costs (P100PYFU) were numerically higher for people who initiated Gla-300 vs long-acting basal insulins/NPH ($111 091 vs $106 833, respectively). Total healthcare costs consisted of medical costs (which were also numerically higher for Gla-300 vs long-acting basal insulins [$110 934 vs $106 620]) and pharmacy costs (which were numerically lower for Gla-300 [$156 vs $213]). Emergency department visit costs were numerically higher for people who initiated Gla-300 vs long-acting basal insulins/NPH ($23 382 vs $20 938), but hospitalization costs were similar between the groups ($73 958 vs $73 884) (Table 3). In the basal insulin–switch cohort, fall/fracture-related total healthcare costs were substantially lower for Gla-300 ($78 929 vs $124 356, respectively), with most of the cost saving being due to reduced medical costs ($78 595 vs $124 045), as pharmacy costs ($334 vs $310) were similar. Hospitalization costs were also substantially lower for people who switched to Gla-300 vs long-acting basal insulins/NPH ($53 927 vs $93 077), whereas ED visit costs ($16 845 vs $16 821) were similar (Table 3).
It is important to note that absolute cost differences between Gla-300 and long-acting basal insulins/NPH did not consistently fall in the same direction as the adjusted cost ratio.
DISCUSSION
The incidence of falls/fractures among adults is increasing,37 with risk being higher in those with diabetes.38 However, hypoglycemia rates are lower for longer-acting vs intermediate- or long-acting basal insulins.17–28 As such, this retrospective study aimed to assess fall/fracture-related outcomes in people with type 2 diabetes aged 50 years and older treated with the longer-acting basal insulin Gla-300 vs the long-acting basal insulins Gla-100 or IDet 100 U/mL, or NPH insulin. The results revealed that fall/fracture-related hospitalization and ED visit event rates in people with type 2 diabetes aged 50 years and older were numerically lower in participants who received Gla-300 vs long-acting basal insulins or NPH insulin, regardless of whether they were naive to basal insulin or switched from another basal insulin.
Our study findings also suggest a positive association between fall/fracture events and hypoglycemia, with incidence rates being numerically higher in individuals with vs without hypoglycemia in all comparisons. However, fall/fracture rates in people with hypoglycemia were variable, and it is notable that rates were lowest in those who switched to Gla-300. Regardless, there were numerically fewer falls/fractures in people who received Gla-300 vs long-acting basal insulins/NPH in both the treatment-naive and the treatment-switch settings.
The HCRU findings in the basal insulin–naive and basal insulin–switch populations corroborate those from other studies. In DELIVER Naive, in people newly initiating basal insulin, rates of any hypoglycemia were similar for Gla-300 and Gla-100, and although rates of hypoglycemia associated with inpatient/ED visits were significantly lower for Gla-300 vs Gla-100 at 3 months (0.04 vs 0.17 per person per year; least squares mean difference, -0.13; P = .003), the difference at 6 months was not significant (0.09 vs 0.15; least squares mean difference, -0.07; P = .093).39 Similar to the current study, the DELIVER 2 and DELIVER 3 studies25,26 reported that in people with type 2 diabetes who switched basal insulin, rates of both hypoglycemia and hypoglycemia associated with inpatient/ED visits were significantly lower in people who switched to Gla-300 vs Gla-100 or IDet 100 U/mL.
In the basal insulin–naive cohorts, the observed mean fall/fracture-related cost differences P100PY were mostly numerically higher for people initiating Gla-300 vs long-acting basal insulins/NPH. This increase was largely driven by increased medical and ED visit costs, with hospitalization costs being similar between treatment groups. However, in the population who switched from another basal insulin, most fall/fracture-related costs were substantially lower for people switching to Gla-300 vs long-acting basal insulins/NPH, except for similar ED visit and pharmacy costs. These results are similar to those of the DELIVER 2 real-world analysis, which showed that switching to Gla-300 vs another basal insulin was associated with an overall HCRU saving of $1439 per person per year.25
It is noteworthy that although costs for Gla-300 decreased in the basal insulin–switch setting relative to the basal insulin–naive setting, costs related to long-acting basal insulins/NPH increased, thus enhancing the apparent cost savings for Gla-300. The finding that most pharmacy costs were numerically higher for Gla-300 than for long-acting basal insulin/NPH analogs is similar to that reported in another claims-based analysis, which showed that for people with type 2 diabetes initially receiving long-acting basal insulin/NPH, switching to Gla-300 vs Gla-100 or IDet 100 U/mL was associated with similar total healthcare costs despite higher pharmacy costs.40 As shown in that study, increased pharmacy costs with Gla-300 may be reflective of better treatment persistence with Gla-300 vs long-acting basal insulin analogs/NPH.40
Strengths and Limitations
The main strength of this analysis is that Optum’s de-identified Clinformatics® Data Mart Database has wide subject coverage and availability of criteria (eg, exposure, outcomes). However, the database may not be representative of all US-based healthcare plan policies; further, it captures only administrative claims submitted for payment by providers and pharmacies, and as such may miss data from individuals paying out of pocket. The study was retrospective, and as no P values or statistical inference was performed, the results are hypothesis-generating only. Other limitations include those common to all administrative claims database analyses (eg, possible coding errors, including medical diagnoses or hypoglycemia). Although the accuracy of major diagnosis codes from the claims database is considered acceptable, the validity of falls and fracture codes might still be considered a limitation. Additionally, while claims data denote the date of prescription fills and days’ supply, information on actual use of medications is not available; it is possible that basal insulin therapy was discontinued after the index date, and differing rates of treatment adherence and discontinuation could have biased the results. Confounding from unmeasured or incorrectly specified confounders may have occurred; however, PSM should have reduced the likelihood of this by ensuring that the distribution of the measured covariates was balanced. Nevertheless, it is notable that there were fewer switches from NPH insulin to Gla-300 than to Gla-100 or IDet. As NPH insulin has the highest associated hypoglycemia risk of all investigated basal insulins, this could have contributed to an underestimation of the effect of switching to Gla-300.
An important limitation of this study is that the low number of events limited interpretation of costs data. Absolute cost differences between Gla-300 and NPH/long-acting basal insulins did not consistently fall in the same direction as the adjusted cost ratio. The event rates in the study were low (~2%), and as cost differences were calculated using mean data, the mean value could have been skewed by data for some people with particular circumstances leading to increased costs. For example, one study reported that medical and hospital-related costs vary depending on the hospital.41 Furthermore, findings of meta-analysis and systematic reviews also suggest that the direction of association between healthcare cost and quality can be inconsistent.42,43 The present study did not include insulin degludec. However, because data from randomized controlled trials confirm that the 2 longer-acting basal insulin analogs (Gla-300 and IDeg) have comparable glycemic efficacy,31 it is likely that the results of this study can be extrapolated.
CONCLUSIONS
The results of this retrospective study indicate that Gla-300 is associated with numerically lower fall/fracture-related hospitalization and ED visit event rates compared with long-acting basal insulins (Gla-100, IDet 100 U/mL) or NPH insulin, regardless of whether individuals were initiating Gla-300 or switching to Gla-300 from a different basal insulin. However, cost analysis suggests that this benefit does not necessarily result in cost savings.
Acknowledgments
The authors thank Charlotte Singh, MD, CMPP,™ and Karen Finnegan, PhD (Sanofi), for their critical review of this manuscript.
Disclosures
G.E.U. has received research grants from the National Institutes of Health (NIH/NCATS UL 3UL1TR002378-05S2), the Clinical and Translational Science Award program, and the National Institutes of Health and National Center for Research Resources (NIH/NIDDK 2P30DK111024-06); has received research support (to Emory University) from Abbott, Bayer, and Dexcom; and has served on advisory boards for Dexcom and GlyCare Health. E.K.P. has received consultancy fees from Sanofi. X.L. was an employee of Sanofi at the time of study conduct. R.P. and J.G. are employees of Sanofi and may hold stocks/shares in Sanofi. N.P. has received funding from the Health Resources and Services Administration (HRSA 6 U1QHP33074-05-01) for the Geriatrics Workforce Enhancement Program (GWEP).
Funding
This study was funded by Sanofi. Medical writing support was provided by Helen Jones, PhD, of Envision Pharma Group, and was funded by Sanofi. Publication tracking by Envision Pharma Group was funded by Sanofi.
Contributions
X.L., R.P., and J.G. contributed to the study design and acquisition and analyses of the data. All authors were involved in the interpretation of the data and in drafting and revising the manuscript for important intellectual content, and all approved the publication for submission and agreed to be accountable for all aspects of the work in ensuring that questions related to the accuracy or integrity of any part of the work are appropriately investigated and resolved. G.E.U. is the guarantor of this work, and as such, had full access to all the data in the study and takes responsibility for the overall integrity of the article.