

BACKGROUND
Economic evaluations are widely used to inform health technology assessment agencies, such as the National Institute for Health and Clinical Excellence in the United Kingdom, about whether the drug’s incremental benefit (eg, improved overall survival [OS]) stand in proportion to its added costs.1 The most widely used decision-making variable in an economic evaluation is the incremental cost-effectiveness ratio (ICER), which is the difference in total cost (TC) of two treatment options (eg, A and B) divided by the difference in total effectiveness (E), and often OS is expressed in life years (LY) (ICER=(TCA-TCB))/(LYA-LYB)). Usually the ICER is expressed as “the cost per LY gained” or as “the cost per quality adjusted life year (QALY) gained.” If the ICER is above a threshold determined by the payer, it will be deemed too expensive and thus should not be funded, whereas the opposite is true for an ICER that falls below the threshold.
Although the decision rules of a cost-effectiveness analysis are easy to apply in theory, the design of an economic evaluation poses a number of challenges. The most prominent one is the collection of data, where the clinical trial is the most essential data source, which ideally would capture all relevant information with regard to long-term improvements in disease progression (DP) and OS. This is however seldom the case, especially in slowly progressing diseases where the majority of the outcomes of interest (for instance, DP or death) manifest after the end of the trial. Even if a longer follow-up was possible, the decision to use a new treatment or not needs to be taken before any observed long-term consequences would be realized. Instead, the primary outcomes in the trial are restricted to surrogate endpoints, which at best are associated with the long-term clinical outcomes of interest. Polycythemia vera (PV) is an example of a slowly progressing disease where trial outcomes mainly consist of effects on surrogate endpoints.
In order to conduct economic evaluations of novel treatments in PV, we have to use health-economic models that combine surrogate endpoints from the trial with long-term observational cohort data of DP and OS. Moreover, to be able to develop such a model, there needs to be an established long-term association between the surrogate endpoint and the clinical outcomes of interest, which in our case are PV-related DP (acute leukemia [AL], myelofibrosis [MF], and thrombosis) and OS.
The primary outcome of most clinical trials of novel treatments targeted at PV is a hematologic response, which primarily includes information about peripheral blood cells (eg, hematocrit <45%), white blood cell and platelet count (WBC <10*109), and bone marrow histology.2,3 An alternative outcome is a molecular response measured as a Janus Kinase 2 (JAK2) (V617F) mutation allele burden, which is present in 95% to 98% of patients with PV.4–8 Although hematologic and molecular response are both able to differentiate the treatment effects of traditional versus novel treatments,9–11 it has not been verified to what extent these treatments have had any effect on long-term DP or mortality in PV.
We have developed a cost-effectiveness model that uses the JAK2 burden as a surrogate endpoint to predict time to DP (AL, MF, and thrombosis) and death in PV. The objective of this study was to validate the long-term predictions of DP and the OS of our model versus predictions of published real-life observational studies. Possible deviations between model estimates and real-life studies will be explored and discussed. This information is essential to clarify to what extent our model is accurate in predicting DP and OS in PV and to explore whether JAK2 is a sensitive surrogate parameter for predicting DP and OS in PV.
METHODS
Model Structure
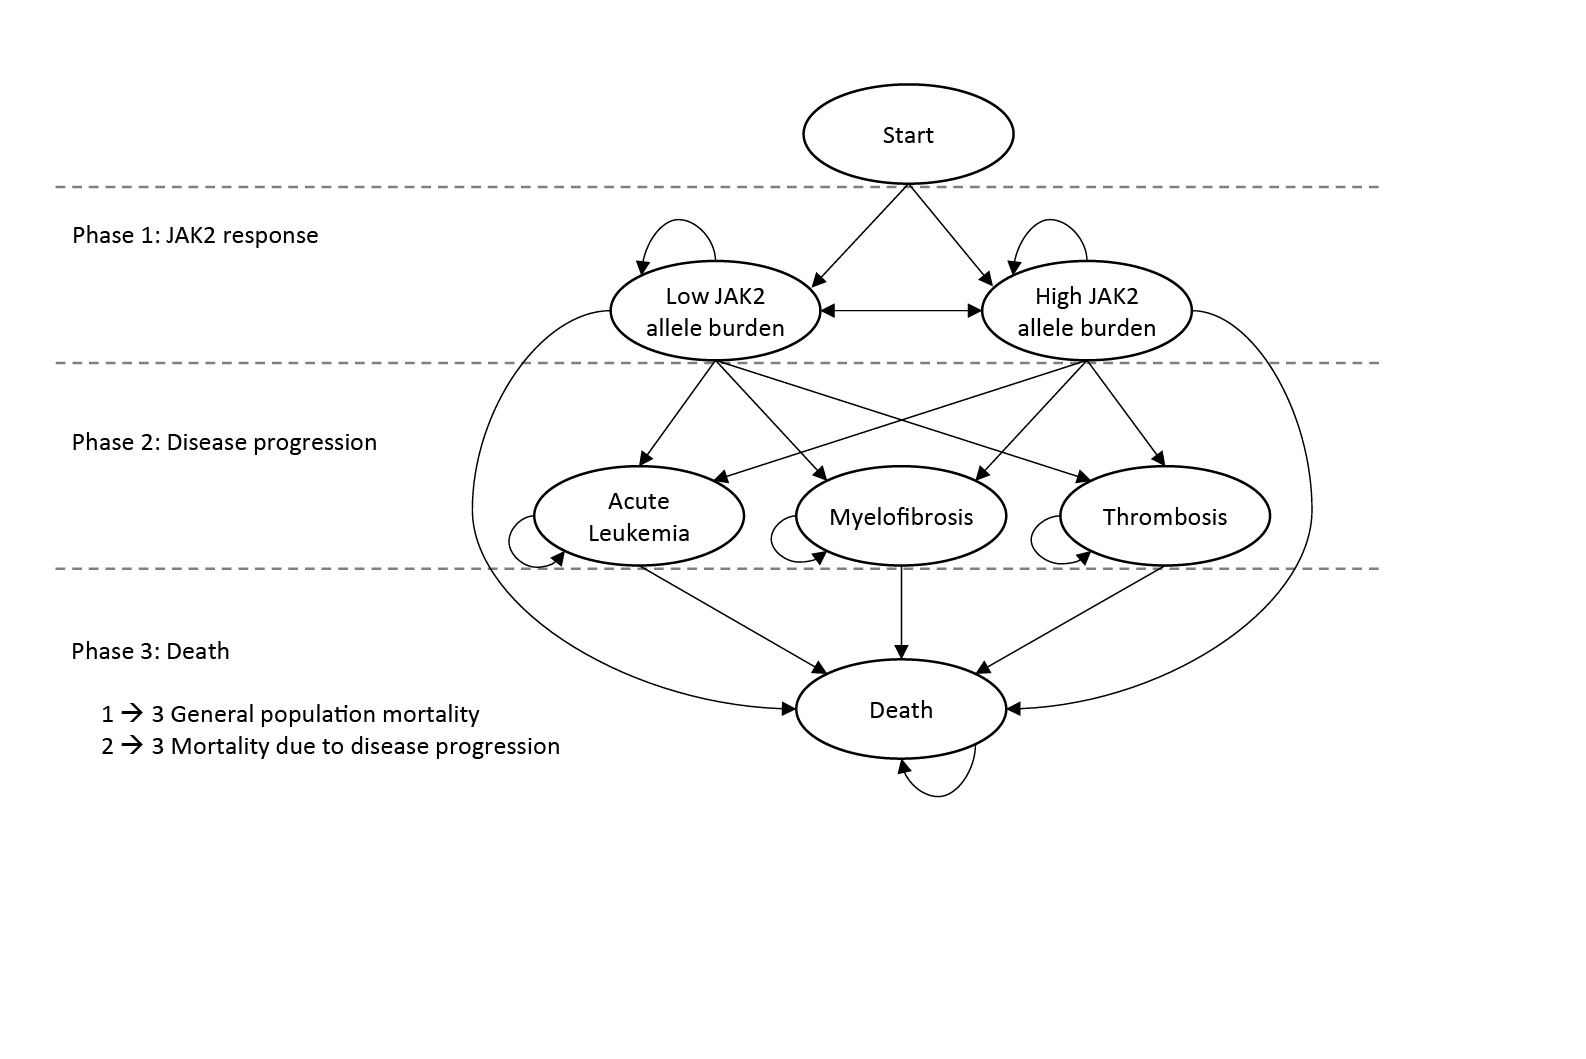
A Markov model aimed at evaluating the cost-effectiveness of novel treatments in PV was developed. An overview of the model structure, with health states (ellipses) and transitions (arrows) between health states, is presented in Figure 1. The patients enter the model in the “Low JAK2 allele burden” (JAK2 burden <50%) or “High JAK2 allele burden” (JAK2 burden ≥50%) health states, and with transitions to the other health states such as AL, MF, thrombosis, or death, each cycle lasts 13 weeks with certain probabilities. Based on the available literature sources, the DP varies depending on JAK2 burden; in the model cycle, probabilities of MF and thrombosis are higher for a JAK2 burden ≥50% versus a JAK2 burden <50%) (phases 1 to 2) (Table 1). While JAK2 burden affects survival indirectly through the risks of progression, it was assumed to have no direct effect on survival, and patients who have not yet experienced DP were assumed to have general population mortality (phases 1 to 3). The cycle probabilities to progress to AL, MF, and thrombosis, as well as mortality in these states (phases 2 to 3), were calculated based on summary estimates (including incidence rates, cumulative incidence, risk ratios, and median OS) from published sources (Table 1).
JAK2 Burden (Phase 1)
To estimate the longitudinal distribution of patients with JAK2 burdens of <50% and ≥50%, we used a combination of data from the PROUD-PV and the CONTINUATION-PV clinical trials.28 The PROUD-PV study was a 12-month phase 3 open-label, randomized, controlled, parallel-group, non-inferiority study (ropeginterferon alfa-2b vs hydroxyurea [HU]) including both HU-naive and currently treated patients diagnosed with PV. The CONTINUATION-PV was an extension study (to the PROUD-PV study) designed to provide long-term evaluation of ropeginterferon alfa-2b and the best available therapy in patients with PV who received the investigational medicinal product subcutaneously or HU during the PROUD-PV study.
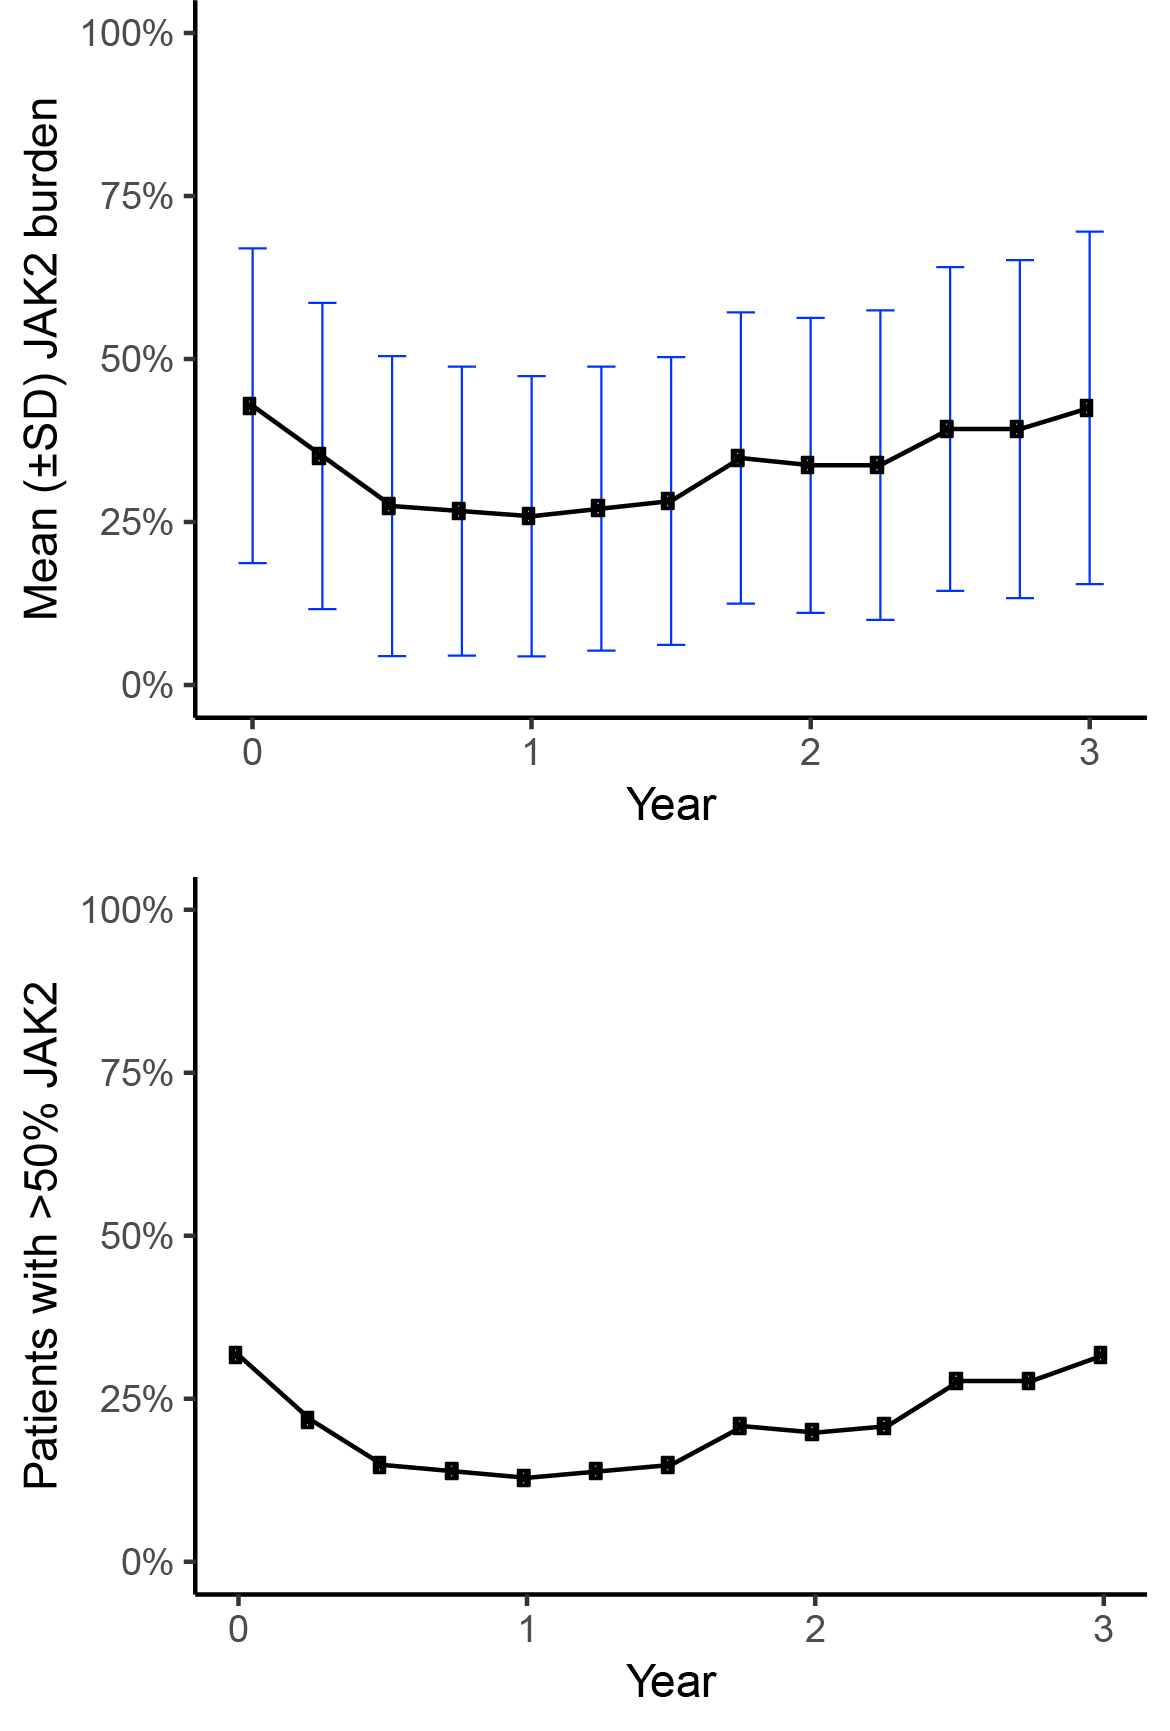
The model is capable of predicting and evaluating DP and OS for any currently existing PV treatment, but it is also able to assess novel technologies not yet on the market. However, for the purpose of model validation, we need to populate the model with trial data of currently existing treatments since we are then able to compare this with matching real-world evidence. Therefore, we only use the JAK2 data from the HU treatment arm since HU is an established treatment that can be considered a standard of care for patients with PV.29,30 The combined PROUD-PV and CONTINUATION-PV JAK2 burden results of the 156 weeks of follow-up are presented both in terms of the JAK2 mean value and patients with JAK2 ≥50% for each 13-week cycle (Figure 2). Since the follow-up period of the trial ends at week 156 and we have no knowledge about the future evolution of JAK2, we conservatively assumed that the mean JAK2 burden was at a constant level after week 156.
_and_modeled_proportion_of_patients_with_jak2_burden___50_.jpg)
Risks of DP (Phase 2)
The risks of DP in the model are shown in Table 1, which indicates the source from which each risk was derived and which risks are active in the base case model. Each risk in the model has been derived from published summary data, and all risks have been transformed to 13-week probabilities. There is evidence of a correlation between the JAK2 burden and the risk of thrombosis and transformation to MF, with especially strong evidence in the latter.12 We did not find evidence of a relationship between the JAK2 burden and AL, and therefore both JAK2 groups were assumed to have the same risk of transition to AL.
Risks of Mortality (Phase 3)
Patients who have not yet experienced DP were assumed to have general population mortality (phases 1–3), as a direct effect of the JAK2 burden on survival has not yet been reported to our knowledge. The cycle probability of mortality prior to DP is assumed to be the same as for the general population of Sweden (using life tables from Statistics Sweden). Annual rates were converted to 13-week cycle mortality rates. Thirteen-week cycle probabilities of mortality for patients who are in a DP state (Table 2) were derived from observational studies with data on cumulative mortality for PV patients with AL, thrombosis, and MF, respectively.
Model Validation
Longitudinal mortality (KM analysis) and DP (AL, MF, and thrombosis) data were identified via PubMed searches. The objective was to target longitudinal cohort studies that included information on baseline JAK2 burden and with a follow-up period sufficiently long enough to validate long-term model predictions (>10 years). Details of the literature search are presented in the Supplementary Material. KM survival curves from publications were extracted using the freeware WebPlotDigitizer (version 4.2., San Francisco, CA: Ankit Rohatgi; 2019, https://automeris.io/WebPlotDigitizer), by manually selecting the corners of the graphed lines (in case the breakpoints of the graphs were not clearly visible, the default algorithm was used to depict the graphed line). The extracted data were transferred to the statistical software R (R Core Team (2018), R Foundation for Statistical Computing, Vienna, Austria) where the data points were used to plot the OS curves.
The model validation included visual comparisons of modeled OS curves versus KM survival curves from publications for different time intervals (years 1–10 and 11–20) and comparison of the AUC estimates of mean OS, expressed as LY, of the model and the corresponding estimates of the included publications. The estimates of mean OS are restricted to the investigated time periods (10-year intervals and 20 years in total).
RESULTS
Studies Used in the Validation of the Model
Table 2 shows the three selected studies of the literature search used for validation of the model. The included studies were published between 2012 (Malak et al. study) and 2016 (Alvarez-Larrán et al. study), and all studies have maximum follow-up periods extending over a time period of 20 years, which means that they represent a treatment paradigm that goes back to the 1990s. The patients in the Alvarez-Larrán study were stratified into two groups: masked and overt PV. The group with overt PV, according to the WHO definition (n=83), was used in the model validation. The median follow-up period of Malak et al. was twice as long (12 years) as Bai et al. (6 years) and Alvarez-Larrán et al. (6.4 years). Patients appear to be a bit younger in Bai et al. (median age is 54 years) compared to Malak et al. (58 years) and Alvarez-Larrán et al. (64 years). All three studies presented data of hematologic key variables at the baseline that were similar at diagnosis with regard to blood values, age distribution, and number of patients. The JAK2 V617F allele burden >50% was found in 61% of patients in the Bai and Alvarez-Larrán studies compared to 31% in the Malak study. The Malak study had more patients on alkylating agents than Bai (27% vs 4%).
Model Base Case Results
Table 3 shows the unadjusted base case model results in terms of DP and mean survival over a 20-year time horizon. Starting age was set to 57 and mean JAK2 allele burden at the baseline was 42.8, with a development in JAK2 burden over the first three years as illustrated in Figure 2. The 20 years of cumulative incidence of DP in the simulated PV population was 4%, 12%, and 30% for AL, MF, and thrombosis, respectively. The mean LY over the 20-year period was 16.6 years, while the corresponding figure for the general population was 18.5 years. The model was also run with subgroups with the JAK2 allele burden consistently below or above the 50% threshold. The incidence of MF and thrombosis were higher in the >50% group compared to the <50% group (29.3% vs 2.1% and 37.6% vs 25.8%). The incidence of leukemia was slightly lower in the >50% group than in the <50% group (3.0% vs 4.4%). The risk of leukemia is by construction equivalent between the two groups, but the cumulative incidence differs since the groups have different competing risks (MF and thrombosis) in the model.
Validation of DP
Cumulative incidence of DP in the model was compared to observed outcomes for each study included in the validation. The model was run with a baseline age and JAK2 burden set to match each of the studies. The model time horizon was set to the same as the time period corresponding to each observed outcome. In the cases where cumulative incidence was not reported for explicitly specified time periods, it was assumed that the time horizon was equal to the median follow-up of the validation study.
Overall, the cumulative incidences observed in the model were lower than in the studies included in the validation (Table 4). The cumulative median 12 years of AL incidence in Malak et al. was 7.9 times higher than the prediction of the model (22% vs 2.8%), whereas incidence of MF and thrombosis were 2.7 (21% vs 7.9%) and 2.0 times higher (42% vs 21%), respectively. The cohort in Bai et al. study had six years of median follow-up but reported relatively high numbers of complications. Cumulative incidence of AL was 3.7 times higher compared to the model (5.5% vs 1.5%) whereas MF and thrombosis were about 3.0 (23% vs 7.6%) and 3.1 (44% vs 14%) times higher, respectively. When compared to the cohort in Alvarez-Larrán et al., the cumulative incidences of the model were close, with minor differences in AL (3.6% vs 2.3%) and thrombosis (22.5% vs 21%) and a small difference in MF (14.0% vs 11.3%).
Validation of OS and KM Curves
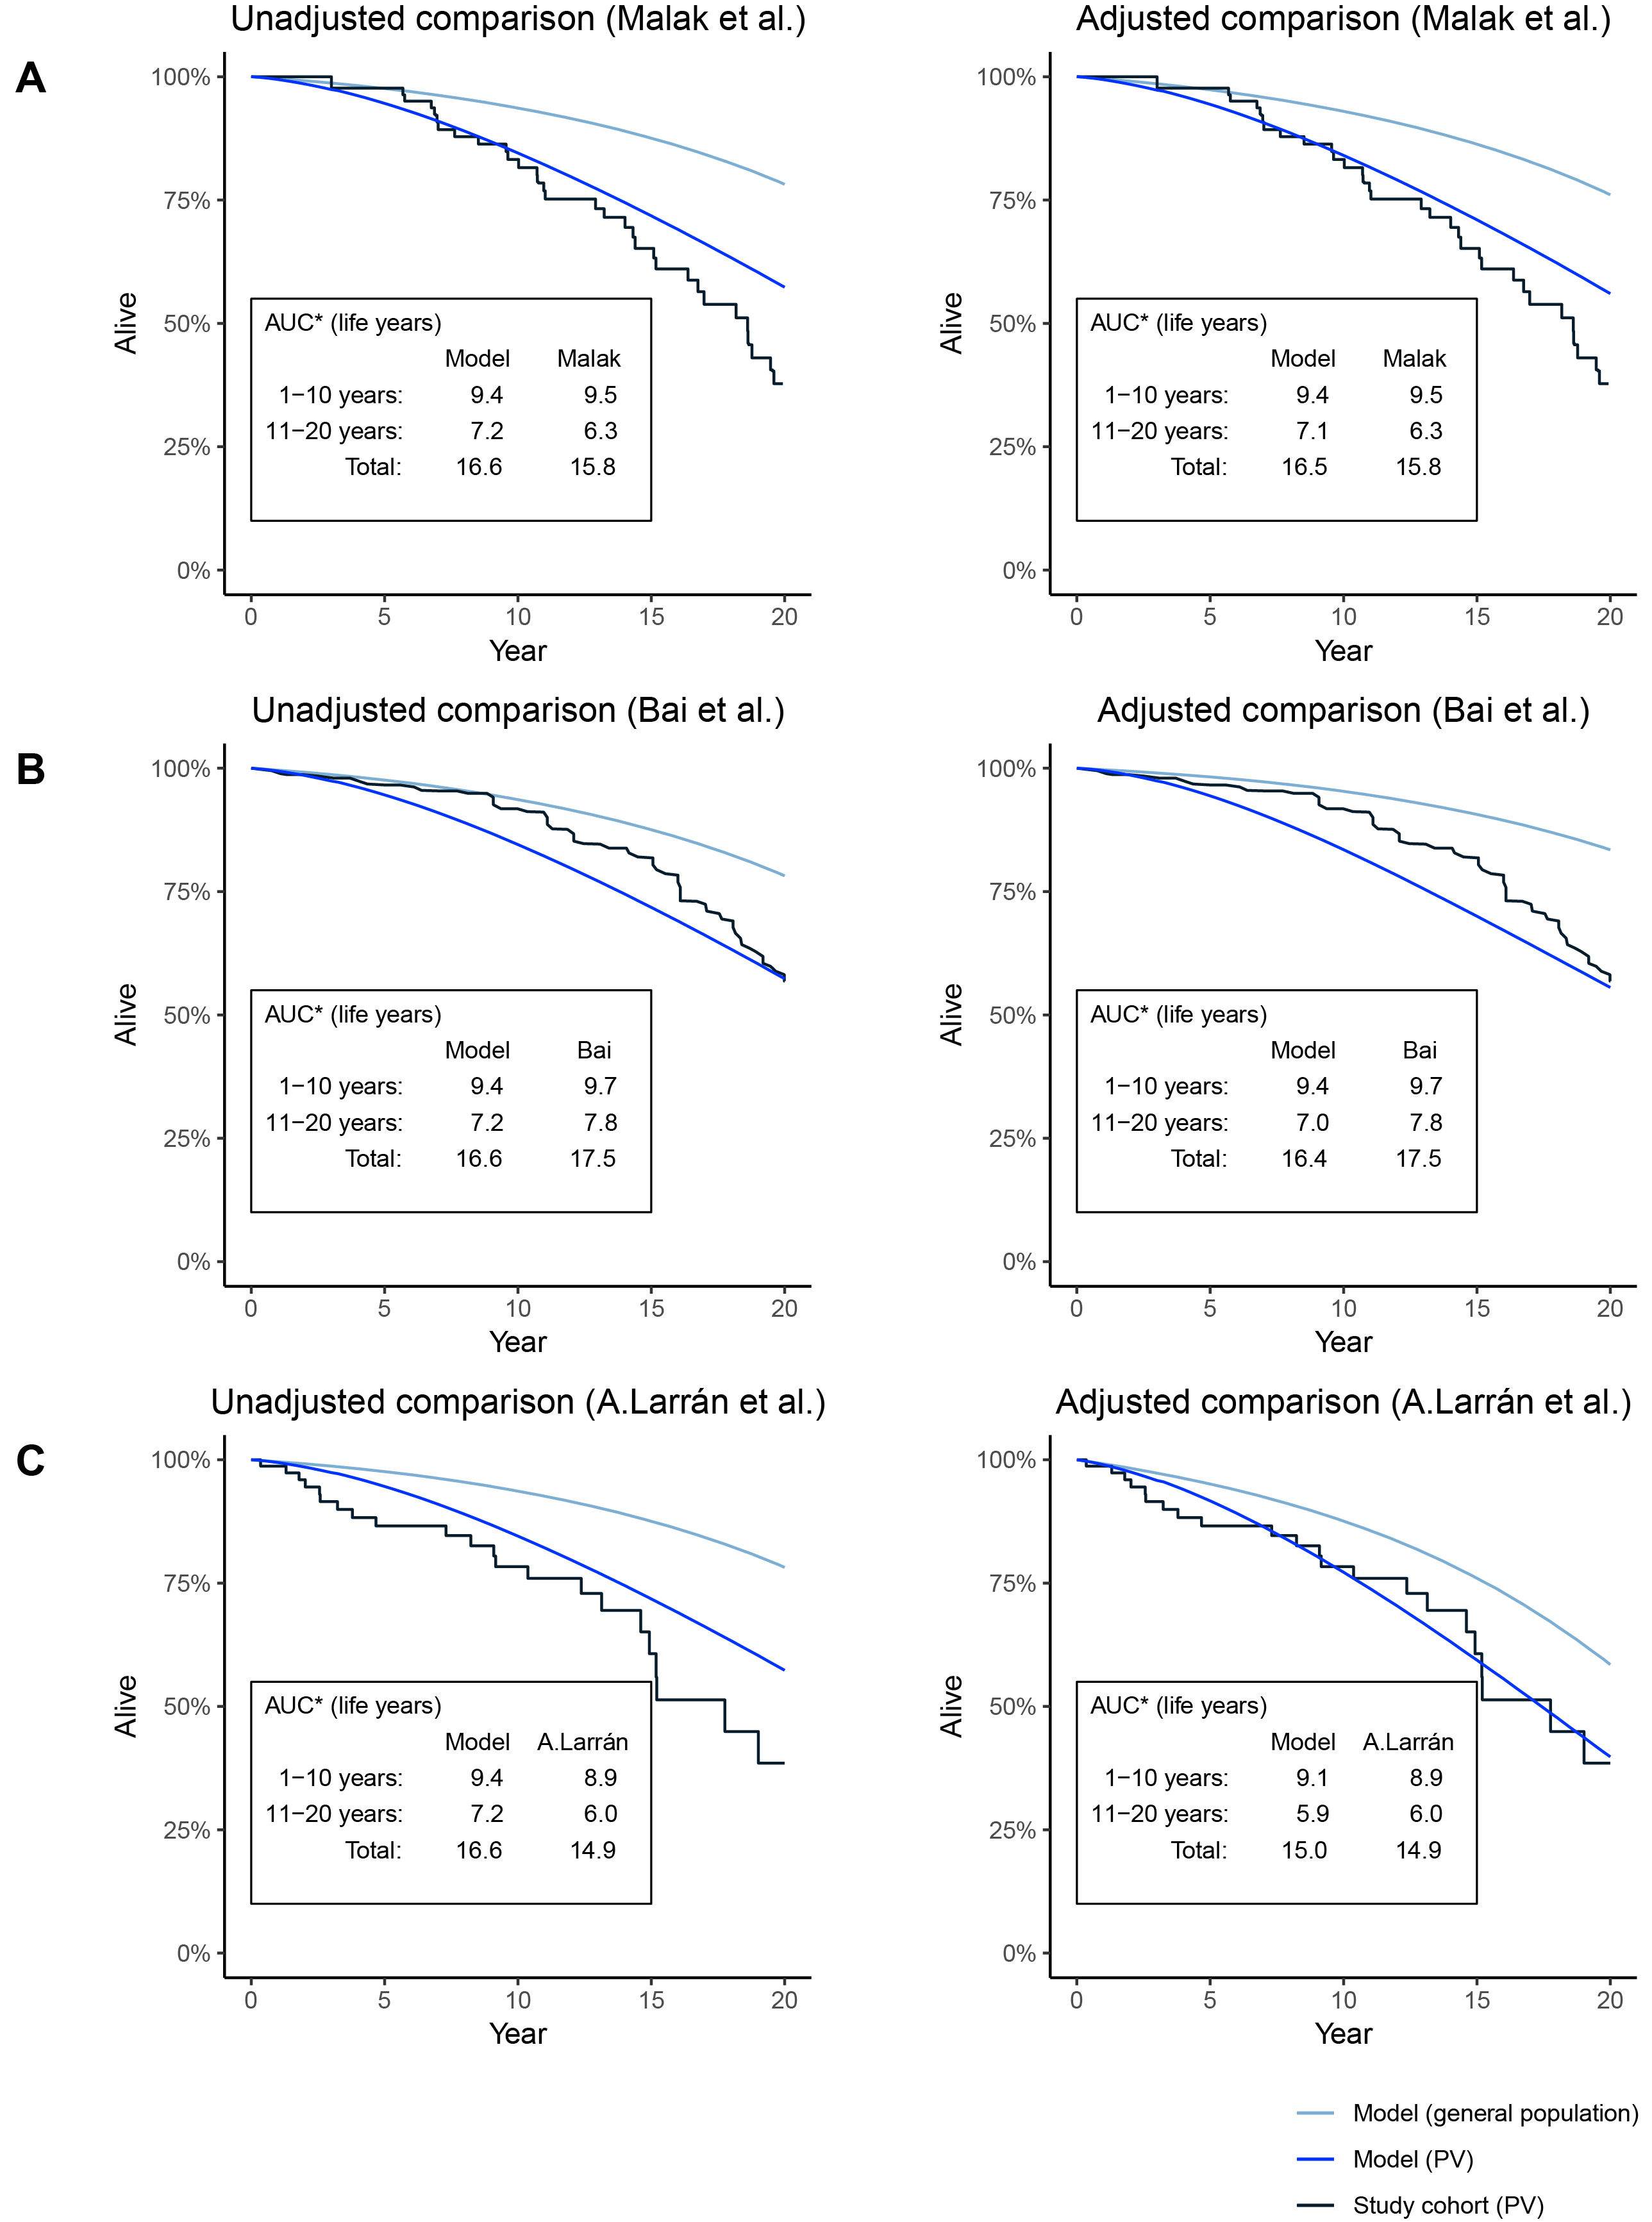
Figure 3A–C illustrates the KM curves of the cohorts from the included studies and the model OS curves, using both unadjusted and adjusted models. In the adjusted models, mean age and baseline mean JAK2 have been equalized between the model and the studies.
The comparison between the adjusted model and the cohort in Malak et al. (Figure 3A) indicates a good visual fit for the first 10 years (AUC was 9.4 and 9.5 LY for the model and study cohort, respectively), whereas there is some divergence after year 10 up to year 20 (model: 7.1 LY; study cohort: 6.3 LY). In this case, the difference in survival between the adjusted and unadjusted model was very limited.
When comparing the model with the cohort in Bai et al. (Figure 3B), there was some divergence starting from the middle of the first 10 years (adjusted model: 9.4 LY; study cohort: 9.7 LY). After about 15 years, the mortality in the study cohort seems worse than the model, which leads to a convergence of the survival between year 11 and 20 (adjusted model: 7.0 LY, study cohort: 7.8 LY). The adjustments of JAK2 and age in the model had an insignificant impact on the results. The baseline age was adjusted downwards and the mean JAK2 burden was adjusted upwards, which explains why the survival of the overall PV population is slightly worse compared to the unadjusted model, while at the same time, the general population survival was higher in the adjusted model.
The unadjusted model had higher survival over 20 years than the cohort in Alvarez-Larrán et al. (Figure 3C), which was expected due to the age difference (57 and 64 years in model and study, respectively). Adjustments led to a good overall fit and the AUC was close to equal for years 1–10 and years 11–20 (adjusted model: 9.1 and 5.9 LY; study cohort: 8.9 and 6.0 LY).

Impact on OS of Using Different Sets of Risks of Progression and Mortality
Sensitivity analyses were performed for each of the three validation studies by setting baseline characteristics according to the validation study and applying different sets of risk levels (Table 1) for progression (AL, thrombosis, and MF) and mortality. Using different combinations of the available risk levels in the model resulted in a range of estimated mean OS for each validation study. In the comparison between the model and the cohort in Malak et al., the estimated 20-year survival ranged between 15.8 and 17.1 LY (16.5 LY in the base case), which means that the lower bound of the range just reached the estimate from the study cohort (15.8 LY). In the comparison between the model and the cohort in Bai et al., the estimated 20-year survival ranged between 15.4 and 17.3 LY (16.4 LY in the base case). In this case, the upper bound of the range was still slightly below the study cohort (17.5 LY). In the comparison between the model and the cohort in Alvarez-Larrán et al., the estimated 20-year survival ranged between 14.2 and 15.8 (15.0 in base case), meaning that the range of estimated survival overlapped that of the study cohort (14.9 LY).
OS for Patients JAK2 <50% and JAK2 ≥50%
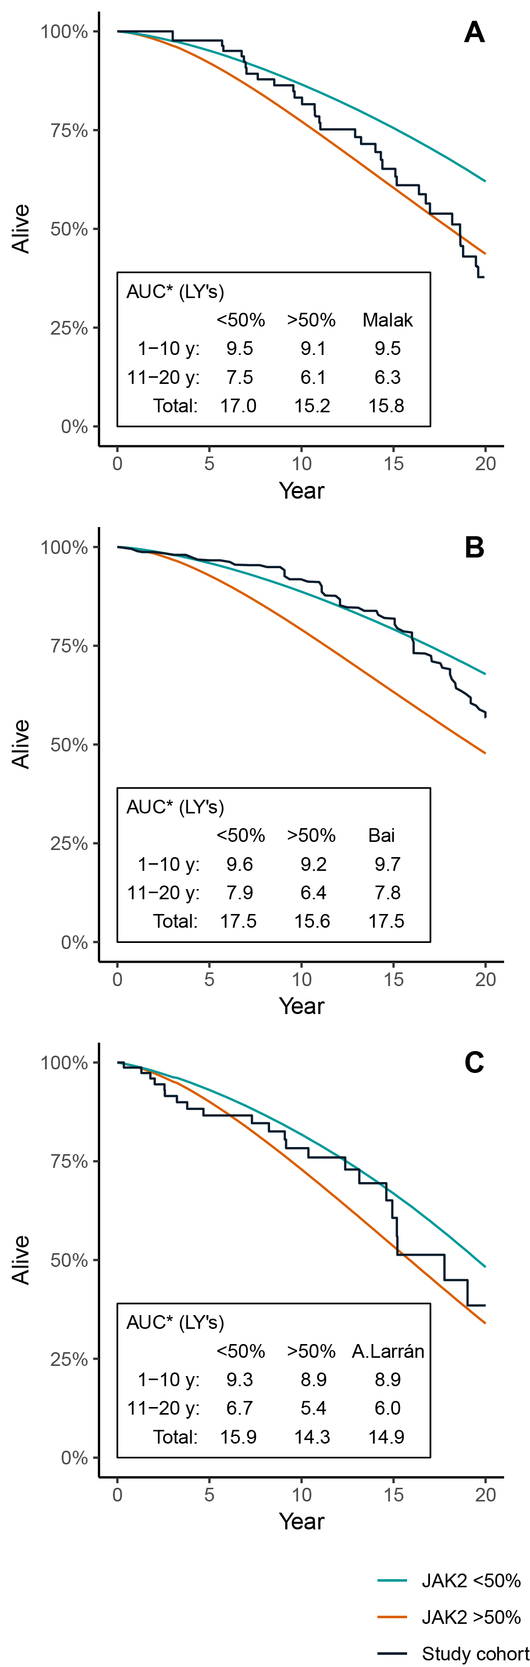
To further illustrate what potential impact the JAK2 burden has in the model, the model was run with subgroups with the JAK2 allele burden consistently below or above the 50% threshold, with a starting age set to match the validation cohorts. Figure 4A–C illustrates the KM curve of each validation cohort, compared to the model OS curves when keeping all patients at either >50% or <50% JAK2 burden throughout the simulation. The validation cohorts from Malak et al. (Figure 4A) and Alvarez-Larrán et al. (Figure 4C) seem to have survival curves located within the modeled curves of patients with a high and low JAK2 burden, whereas the cohort from Bai et al. (Figure 4B) is closer to the model scenario with low JAK2. There seems to be a general tendency that the observed survival curves of the validation cohorts are skewed in the sense that they are initially flat and then, after 10 to 15 years, begin to steepen.
DISCUSSION
Economic models help health technology assessment organizations and payers make sound judgments on the potential health benefits that may be manifested far beyond the time horizon of the clinical trial and put these into the context of the high expenses that are payed prior to the realization of the benefits. The accuracy of the models in predicting DP and OS is fundamental in order to properly assess to what extent a PV drug brings value to patients and society. Trust and confidence are critical to the success of the economic models, and validation of how well the model reflects “reality” is a key component of the model development process.33 The question is then whether payers could put trust and confidence in a model that uses a surrogate endpoint such as JAK2 to predict DP and survival of PV?
We developed an economic model for PV that combines data from multiple sources such as clinical trials and long-term observational cohort studies.12–14,16–28 The objective of this study was to validate the model that uses JAK2 burden as a surrogate endpoint to predict DP and OS based on progression-specific mortality.
The results of the validation indicated a good correspondence between the model and the published observational studies available for comparisons. The mean OS in the published observational studies16,31,32 that was included in the validation of the model was 14.9 to 17.5 years over a 20-year time horizon. When we adjusted our model’s baseline age and baseline JAK2 burden to match the studies’ variables, our model predicted a mean OS that ranged between 15.0 to 16.5 years. When we combined risk levels to establish a range of possible OS levels, our model provided an OS range of 14.2 to 17.3 LY depending on age and baseline JAK2. Only the study by Bai et al16 had an OS (17.5 LY) that slightly fell outside of the modeled OS range.
The cumulative incidence of MF, leukemia, and thrombosis were considerably lower in the model for the average population than in the studies, except for the Alvarez-Larrán study32 where the incidences were relatively similar. For separate model simulations of JAK2 subgroups, the incidences of MF and thrombosis reached considerably higher levels for patients with JAK2 >50%, which might imply that possible differences in JAK2 levels across different studies could explain differences in incidence of MF and thrombosis.
Differences in predictions of the model and the outcomes in the observational studies could partly be contextual in the sense that our model was based on data from multiple sources where the patient populations differed from the populations in the studies that were included in the validation. For instance, the study by Bai et al16 included only Chinese patients, who had a higher incidence of MF transformation than western cohorts. The treatment pattern in the Bai et al study also differed in the sense that it included considerably more patients treated with interferon-α alone, which has been shown to have a positive effect on OS.34 The patients in the Malak study31 had a longer observation time and treatment pattern with increased leukemia transformation risk, which may account for a higher leukemia incidence and higher mortality. Also, the Malak study included only patients with familial myeloproliferative neoplasms, which may have different characteristics than sporadic myeloproliferative neoplasms.
Another explanation for the differences could simply be statistical uncertainty as the studies included in the validation were rather small with sample sizes ranging from 83 to 272 patients. Although we encountered observational studies with larger cohorts of patients with PV in the literature search, such studies did not meet the inclusion criteria of a long follow-up and the data on JAK2 burden and mortality. Limited data are a general problem for orphan diseases such as PV and add to the complexity of making sound economic assessments of technologies aimed at treating these diseases.35 One way to reduce this uncertainty in modeling is to combine data from good quality clinical trials, including appropriate and relevant markers of DP and OS, with long-term longitudinal observational registry data. Such registries are to some extent already available, and publications have presented results of associations between hematocrit levels (eg, Crisa et al., 2010),36 white blood cell counts (eg, Tefferi et al., 2013),15 and OS in PV patients. Although these studies included considerably more patients (up to 1545) than the studies that were used to validate the model, we were not able to use them since no JAK2 data were available in these publications.
One limitation with the published data we had at hand was that we were not able to identify the evolution of JAK2 over time and we were therefore not able to adjust our model based on these potential variations. Instead, the same three-year evolution of JAK2 as observed in the HU treatment arm in the PROUD-PV and CONTINUATION-PV was assumed to apply, as we only adjusted the baseline JAK2 values to match the observational studies. When we compared the OS estimates of our model with the published studies, we were not able to find a consistent pattern of model versus the studies with respect to the time horizon; in one case, the fit was better during the first 10-year period compared to the second 10-year period, and in another case, the model showed lower survival than the study in the first 10-year period and then higher survival than the study in the second 10-year period. However, when we simulated OS for patients with JAK2 that is <50% and JAK2 that is ≥50 separately, we noticed that predictions based on JAK2 that is <50% generally fit the OS of the studies better up to year 10, whereas the OS predictions of JAK2 that is ≥50 had a better fit with the studies after year 10. The results might suggest that a change of JAK2 status over time influences OS for patients with PV. The clinical trial data that were used in the model did not provide observations of JAK2 burden after year three. Therefore, the level of JAK2 burden in our model was kept constant after year three and did not capture the potential longitudinal effect a higher JAK2 burden may have on the rate of DP and mortality.
Future observational studies should be designed to capture the effect of JAK2 burden and its long-term impact on DP and mortality. It is especially important to investigate the impact various treatments might have on JAK2 evolution over time, which might provide valuable information for development of existing treatment guidelines. Furthermore, a more granular cutoff than JAK2 that is >50% might be beneficial to provide guidance in clinical practice and to identify when a drug provides incremental benefit compared to other alternatives.
Another limitation with the observational studies was the lack of reported numerical estimations of OS over time. To obtain OS estimates for different time points, we had to extract KM data using a digitizer software. We thus had to rely on the KM data plots being correct and reflecting the actual study result. The digitizer tool we used has generated data into several other published modeling studies,37–40 and we feel confident that the results that formed the basis of our model validation were reasonably reliable.
One might argue that our validation only included three studies and therefore lacks enough power to evaluate whether our model provides sound estimates of DP and OS. However, the results of our model validation clearly show that comparisons of study results are complex and are not just about the number of studies included. For instance, we would believe that high incidences of MF and thrombosis in a PV population would result in shorter survival. However, the Bai et al study had both higher rates of MF and thrombosis and also had longer OS than the other two studies and our model. This is a relationship that is difficult to explain a priori, and in order to validate models in the best possible way, we would need to extract information from publications that might be impossible to obtain.
Apart from the methodologic aspects of using JAK2 as a surrogate endpoint, one may ask why we used this endpoint? We see two important reasons for establishing a model that associates molecular response expressed as JAK2 burden to DP and OS. Firstly, molecular response is not included as part of the definition of response in PV2 and seems to have a “lower” status compared to the established hematologic response definition, despite strong evidence for a correlation between JAK2 burden and transformation to MF.12 Secondly, novel agents in use today have been able to reduce allele burden of the JAK2 V617F mutation in PV, but there is poor knowledge about the potential long-term consequences of keeping control of JAK2 burden.9–11 Separate simulations with our model for patients with JAK2 that is ≤50% and >50% indicate that individuals in the former group had about two years longer survival. Both of these previously stated arguments could be motivation for updating the existing treatment guidelines for PV.
CONCLUSIONS
Our results indicate that it is possible to use JAK2 as a marker for predicting DP and ultimately OS in PV. More powerful long-term observational studies are however needed to provide more robust long-term predictions of absolute magnitude. The results of model simulations, which showed that individuals with a lower JAK2 burden had longer survival, suggest that the JAK2 burden should be followed in clinical practice to monitor the treatment success of novel interventions.
Declaration of funding This study was funded by AOP Orphan Pharmaceuticals AG.
Declaration of financial/other interests Mr. Hjelmgren and Mr. Nilsson are employees of The Swedish Institute for Health Economics (IHE), a consultancy/research firm that has received compensation from AOP Orphan Pharmaceuticals AG to conduct this study. Prof. Birgegård has received conference speaker´s fees from AOP Orphan Pharmaceuticals AG.
Acknowledgement None reported.
Author contributions Mr Hjelmgren developed the model concept and participated in the development of mathematical algorithms. Mr Hjelmgren also participated in writing the manuscript. Mr Nilsson participated in the development of the mathematical algorithms, conducted model simulations, conducted literature research and participated in writing the manuscript. Prof Birgegård provided expert advice in the development of model structure, critically assessed included journals in the literature review and participated in writing the manuscript.